

Epigenetic control of pheromone MAPK signaling determines sexual fecundity in Candida albicans
- PMID: 29255038
- PMCID: PMC5748179
- DOI: 10.1073/pnas.1711141115
Epigenetic control of pheromone MAPK signaling determines sexual fecundity in Candida albicans
Abstract
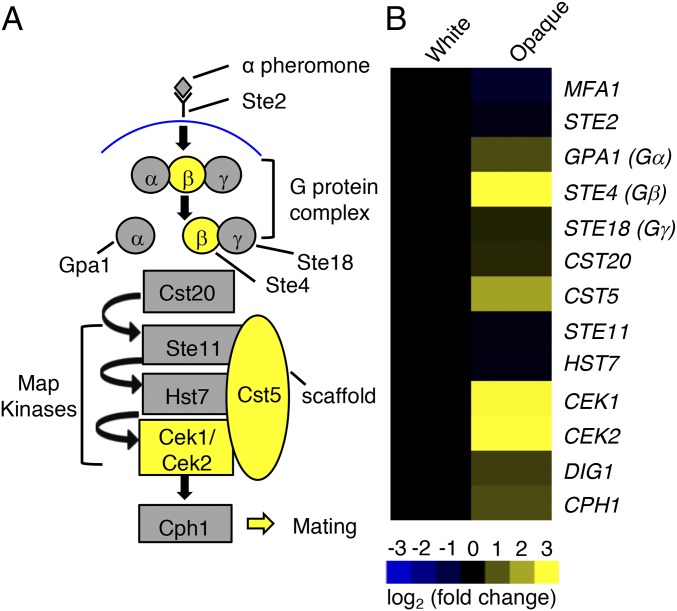
Several pathogenic Candida species are capable of heritable and reversible switching between two epigenetic states, "white" and "opaque." In Candida albicans, white cells are essentially sterile, whereas opaque cells are mating-proficient. Here, we interrogate the mechanism by which the white-opaque switch regulates sexual fecundity and identify four genes in the pheromone MAPK pathway that are expressed at significantly higher levels in opaque cells than in white cells. These genes encode the β subunit of the G-protein complex (STE4), the pheromone MAPK scaffold (CST5), and the two terminal MAP kinases (CEK1/CEK2). To define the contribution of each factor to mating, C. albicans white cells were reverse-engineered to express elevated, opaque-like levels of these factors, either singly or in combination. We show that white cells co-overexpressing STE4, CST5, and CEK2 undergo mating four orders of magnitude more efficiently than control white cells and at a frequency approaching that of opaque cells. Moreover, engineered white cells recapitulate the transcriptional and morphological responses of opaque cells to pheromone. These results therefore reveal multiple bottlenecks in pheromone MAPK signaling in white cells and that alleviation of these bottlenecks enables efficient mating by these "sterile" cell types. Taken together, our findings establish that differential expression of several MAPK factors underlies the epigenetic control of mating in C. albicans We also discuss how fitness advantages could have driven the evolution of a toggle switch to regulate sexual reproduction in pathogenic Candida species.
Keywords: mating; phenotypic switching; sexual reproduction; signaling bottlenecks; transcriptional regulation.
Conflict of interest statement
The authors declare no conflict of interest.
Figures


Similar articles
-
MAP Kinase Regulation of the Candida albicans Pheromone Pathway.mSphere. 2019 Feb 20;4(1):e00598-18. doi: 10.1128/mSphere.00598-18. mSphere. 2019. PMID: 30787119 Free PMC article.
-
Glucose depletion enables Candida albicans mating independently of the epigenetic white-opaque switch.Nat Commun. 2023 Apr 12;14(1):2067. doi: 10.1038/s41467-023-37755-8. Nat Commun. 2023. PMID: 37045865 Free PMC article.
-
Activation of the Cph1-dependent MAP kinase signaling pathway induces white-opaque switching in Candida albicans.PLoS Pathog. 2013;9(10):e1003696. doi: 10.1371/journal.ppat.1003696. Epub 2013 Oct 10. PLoS Pathog. 2013. PMID: 24130492 Free PMC article.
-
Environmental pH adaption and morphological transitions in Candida albicans.Curr Genet. 2016 May;62(2):283-6. doi: 10.1007/s00294-015-0540-8. Epub 2015 Nov 18. Curr Genet. 2016. PMID: 26581628 Review.
-
White-opaque switching in Candida albicans.Curr Opin Microbiol. 2009 Dec;12(6):650-4. doi: 10.1016/j.mib.2009.09.010. Epub 2009 Oct 23. Curr Opin Microbiol. 2009. PMID: 19853498 Free PMC article. Review.
Cited by
-
MAP Kinase Regulation of the Candida albicans Pheromone Pathway.mSphere. 2019 Feb 20;4(1):e00598-18. doi: 10.1128/mSphere.00598-18. mSphere. 2019. PMID: 30787119 Free PMC article.
-
Glucose depletion enables Candida albicans mating independently of the epigenetic white-opaque switch.Nat Commun. 2023 Apr 12;14(1):2067. doi: 10.1038/s41467-023-37755-8. Nat Commun. 2023. PMID: 37045865 Free PMC article.
-
Epistatic genetic interactions govern morphogenesis during sexual reproduction and infection in a global human fungal pathogen.Proc Natl Acad Sci U S A. 2022 Feb 22;119(8):e2122293119. doi: 10.1073/pnas.2122293119. Proc Natl Acad Sci U S A. 2022. PMID: 35169080 Free PMC article.
-
White-opaque switching in Candida albicans: cell biology, regulation, and function.Microbiol Mol Biol Rev. 2024 Jun 27;88(2):e0004322. doi: 10.1128/mmbr.00043-22. Epub 2024 Mar 28. Microbiol Mol Biol Rev. 2024. PMID: 38546228 Free PMC article. Review.
-
Direct Full-Length RNA Sequencing Reveals an Important Role of Epigenetics During Sexual Reversal in Chinese Soft-Shelled Turtle.Front Cell Dev Biol. 2022 Mar 25;10:876045. doi: 10.3389/fcell.2022.876045. eCollection 2022. Front Cell Dev Biol. 2022. PMID: 35399508 Free PMC article.
References
-
- van Drogen F, Stucke VM, Jorritsma G, Peter M. MAP kinase dynamics in response to pheromones in budding yeast. Nat Cell Biol. 2001;3:1051–1059. - PubMed
-
- Schwartz MA, Madhani HD. Principles of MAP kinase signaling specificity in Saccharomyces cerevisiae. Annu Rev Genet. 2004;38:725–748. - PubMed
-
- McClean MN, Mody A, Broach JR, Ramanathan S. Cross-talk and decision making in MAP kinase pathways. Nat Genet. 2007;39:409–414. - PubMed
-
- Dard N, Peter M. Scaffold proteins in MAP kinase signaling: More than simple passive activating platforms. Bioessays. 2006;28:146–156. - PubMed
Publication types
MeSH terms
Substances
Grants and funding
LinkOut - more resources
Full Text Sources
Other Literature Sources
Molecular Biology Databases
