. 2018 Jan 2;115(1):53-58.
doi: 10.1073/pnas.1718063115. Epub 2017 Dec 18.

SIMS analyses of the oldest known assemblage of microfossils document their taxon-correlated carbon isotope compositions

Affiliations

SIMS analyses of the oldest known assemblage of microfossils document their taxon-correlated carbon isotope compositions

J William Schopf et al. Proc Natl Acad Sci U S A. .

Abstract

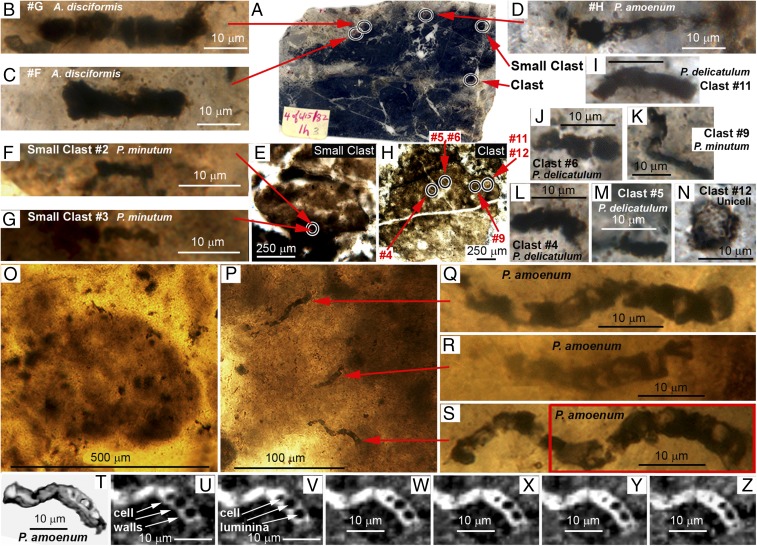
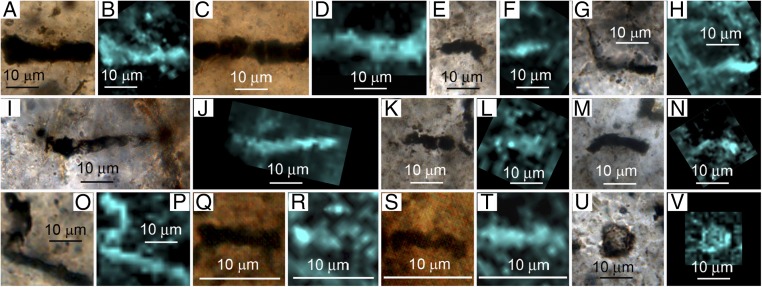
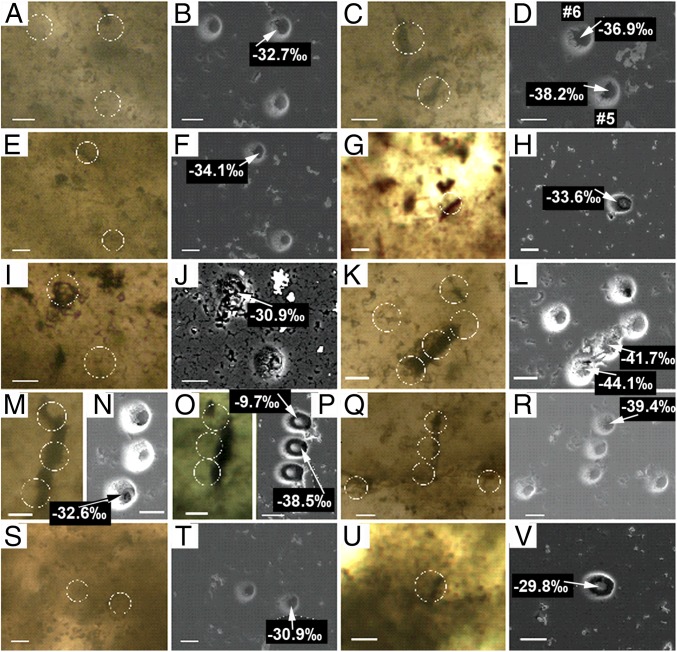
Analyses by secondary ion mass spectroscopy (SIMS) of 11 specimens of five taxa of prokaryotic filamentous kerogenous cellular microfossils permineralized in a petrographic thin section of the ∼3,465 Ma Apex chert of northwestern Western Australia, prepared from the same rock sample from which this earliest known assemblage of cellular fossils was described more than two decades ago, show their δ13C compositions to vary systematically taxon to taxon from -31‰ to -39‰. These morphospecies-correlated carbon isotope compositions confirm the biogenicity of the Apex fossils and validate their morphology-based taxonomic assignments. Perhaps most significantly, the δ13C values of each of the five taxa are lower than those of bulk samples of Apex kerogen (-27‰), those of SIMS-measured fossil-associated dispersed particulate kerogen (-27.6‰), and those typical of modern prokaryotic phototrophs (-25 ± 10‰). The SIMS data for the two highest δ13C Apex taxa are consistent with those of extant phototrophic bacteria; those for a somewhat lower δ13C taxon, with nonbacterial methane-producing Archaea; and those for the two lowest δ13C taxa, with methane-metabolizing γ-proteobacteria. Although the existence of both methanogens and methanotrophs has been inferred from bulk analyses of the carbon isotopic compositions of pre-2,500 Ma kerogens, these in situ SIMS analyses of individual microfossils present data interpretable as evidencing the cellular preservation of such microorganisms and are consistent with the near-basal position of the Archaea in rRNA phylogenies.

Keywords: Apex chert; Archaea; Archean; methanogens; methanotrophs.


Conflict of interest statement

The authors declare no conflict of interest.

Figures

Fig. 1.
Fig. 1.
(AN) Optical photomicrographs showing the locations of (BD, F, G, IN) 11 specimens of five taxa of microfossils analyzed by SIMS embedded in clouds of flocculent organic matter permineralized in (A) petrographic thin section 4 of 6/15/82-1H of the ∼3,465 Ma Apex chert and (E and H) in its contained subrounded carbonaceous clasts. (OS) Optical photomicrographs of (O) a similar clast and (PS) filamentous microfossils in petrographic thin section 4 of 6/15/82-1B archived at London’s NMH (2). (T) 3D and (UZ) 2D Raman images of the part of the specimen enclosed by the red rectangle in S. (A) Thin section 4 of 6/15/82–1H. (B and C) A. disciformis Schopf 1993 (specimens #G and #F, respectively). (D) P. amoenum Schopf 1992 (specimen #H). (E) Small clast. (F, G, and K) P. minutum Schopf 1993 (small clast specimens #2 and #3, and clast specimen #9, respectively). (H) Clast. (I, J, L, and M) P. delicatulum Schopf 1992 (clast specimens #11, #6, #4, and #5, respectively). (N) Unnamed unicell (clast specimen #12). (O) A subrounded carbonaceous clast. (PS) Organic clast-enclosed specimens of P. amoenum, the arrows in P denoting their locations within the clast. (TZ) Raman images (acquired in a spectral window centered on the kerogen “G” band at ∼1,605 cm−1) in which the 3D image in T has been rotated to show the cylindrical morphology of the filament and UZ show 2D images at increasing depths through the specimen (U, 0.75 µm; V, 1.5 µm; W, 2.25 µm; X, 3.0 µm; Y, 3.75 µm; Z, 4.0 µm) that document its box-like kerogenous cell walls (arrows in U) and their enclosed cell lumina (arrows in V).
Fig. 2.
Fig. 2.
(A, C, E, G, I, K, M, O, Q, S, and U) Eleven specimens of five taxa of filamentous microfossils analyzed by SIMS in petrographic thin section 4 of 6/15/82-1H of the ∼3,465 Ma Apex chert shown in transmitted light photomicrographs and (B, D, F, H, J, L, N, P, R, T, and V) 2D Raman images that document the distribution of kerogen (blue, acquired in a spectral window centered on the kerogen “G” band at ∼1,605 cm−1). (AD) A. disciformis Schopf 1993 (A and B, specimen #F; C and D, specimen #G). (EH) P. delicatulum Schopf 1992 (E and F, clast specimen #4; G and H, clast specimen #5). (I and J) P. amoenum Schopf 1992 (specimen #H). (KN) P. delicatulum Schopf 1992 (K and L, clast specimen #6; M and N, clast specimen #11). (OT) P. minutum Schopf 1993 (O and P, clast specimen #9; Q and R, small clast specimen #2; S and T, small clast specimen #3). (U and V) Unnamed unicell (clast specimen #12).
Fig. 3.
Fig. 3.
Paired images of pre-SIMS transmitted light photomicrographs (color) and post-SIMS SEM images (black and white) of 11 specimens of five taxa of microfossils analyzed for δ13C in petrographic thin section 4 of 6/15/82-1H of the ∼3,465 Ma Apex chert. (A and B) Clast specimen #4; (C and D) clast specimens #5 and #6; (E and F) clast specimen #9; (G and H) clast specimen #11; (I and J) clast specimen #12; (K and L) specimen #F; (M and N) specimen #G (session-1); (O and P) specimen #G (session-2); (Q and R) specimen #H; (S and T) small clast specimen #2; and (U and V) small clast specimen #3. White circles in the photomicrographs indicate the locations of the SIMS-produced analytical pits. In the SEM images, J is a back-scattered electron image; all others are secondary electron images. These SEM images were acquired in sections veneered with a thin (<∼5-nm-thick) gold coat after removal of a thicker Au coat used during SIMS analyses and show the locations of analyzed spots having high (≥3 Mcps/nA) and marginally accepted (3 Mcps/nA to 1.5 Mcps/nA) 12C yields. Not shown are carbon-poor analytical pits and SIMS-obtained δ13C measurements considered not to be reliable. See Supporting Information for additional analytical data. (Scale bars, 10 µm.)

References

    1. Schopf JW. Paleobiology of the Archean. In: Schopf JW, Klein C, editors. The Proterozoic Biosphere, A Multidisciplinary Study. Cambridge Univ Press; New York: 1992. pp. 25–39.
    1. Schopf JW. Microfossils of the early Archean Apex chert: New evidence of the antiquity of life. Science. 1993;260:640–646. - PubMed
    1. Moorbath S. Palaeobiology: Dating earliest life. Nature. 2005;434:155. - PubMed
    1. Brasier MD, et al. Questioning the evidence for Earth’s oldest fossils. Nature. 2002;416:76–81. - PubMed
    1. Brasier MD, et al. Critical testing of Earth’s oldest putative fossil assemblage from the ∼3.5 Ga Apex chert, Chinaman Creek, Western Australia. Precambrian Res. 2005;140:55–102.

Publication types

Substances