. 2018 Jan 1;200(1):3-22.
doi: 10.4049/jimmunol.1701494.

A Beginner's Guide to Analyzing and Visualizing Mass Cytometry Data

Affiliations

A Beginner's Guide to Analyzing and Visualizing Mass Cytometry Data

Abigail K Kimball et al. J Immunol. .

Abstract

Mass cytometry has revolutionized the study of cellular and phenotypic diversity, significantly expanding the number of phenotypic and functional characteristics that can be measured at the single-cell level. This high-dimensional analysis platform has necessitated the development of new data analysis approaches. Many of these algorithms circumvent traditional approaches used in flow cytometric analysis, fundamentally changing the way these data are analyzed and interpreted. For the beginner, however, the large number of algorithms that have been developed, as well as the lack of consensus on best practices for analyzing these data, raise multiple questions: Which algorithm is the best for analyzing a dataset? How do different algorithms compare? How can one move beyond data visualization to gain new biological insights? In this article, we describe our experiences as recent adopters of mass cytometry. By analyzing a single dataset using five cytometry by time-of-flight analysis platforms (viSNE, SPADE, X-shift, PhenoGraph, and Citrus), we identify important considerations and challenges that users should be aware of when using these different methods and common and unique insights that can be revealed by these different methods. By providing annotated workflow and figures, these analyses present a practical guide for investigators analyzing high-dimensional datasets. In total, these analyses emphasize the benefits of integrating multiple cytometry by time-of-flight analysis algorithms to gain complementary insights into these high-dimensional datasets.


Figures

Figure 1
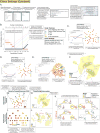
Figure 1. Important considerations in CyTOF experimental design and algorithm implementation
Examples of the type of research questions that can be answered by CyTOF (A), and considerations in the use of different CyTOF algorithms (B).
Figure 2
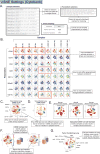
Figure 2. Basic considerations for viSNE analysis
Input settings (A) and graphical representation of viSNE analysis using the Cytobank platform, with data representing CyTOF analysis of γHV68-infected lungs from either B6 or IL10KO individuals at 9 days post-infection (B-F) or B6 mice orthotopically implanted with the LLC tumor cell line (G). Data show all viable single cells, subjected to the t-distributed stochastic neighbor embedding (t-SNE) algorithm which provides each cell with a unique coordinate according to their expression of the 35 measured parameters, displayed on a two-dimensional plot (tSNE1 vs. tSNE2). (A) Input settings to run the viSNE algorithm in Cytobank. (B) Visualization grid of viSNE plots, with plots arranged according to marker expression (rows) relative to individuals (columns). (C) Identification of cellular populations identified by viSNE for individual B6 #1, with cell populations defined based on basic phenotypic markers (see Methods). (D) An additional viSNE plot produced using identical settings for individual B6 #1 and colored by CD45 demonstrating variable output of viSNE across independent runs, potentially reflecting variable viSNE calculation and events sampled. (E) Comparison of three sequential viSNE runs, in which the exact same 9,141 cells were subjected to viSNE, demonstrates variable cellular distribution (for individual B6 #3). (F) Reciprocal viSNE overlays comparing the topography of the viSNE plots from B6 and IL10KO mice. (G) viSNE analysis of cellular populations from a tumor-containing lung, with cell populations defined based on basic phenotypic markers. Data from virus-infected lungs (B6, n=5; IL10KO, n=4 mice), or from naïve (right and left lobes of lung pooled together from n=2 mice) and LLC-luc tumor-containing lung (left lobe of lung pooled from n=2 mice) per condition.
Figure 3
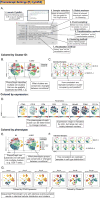
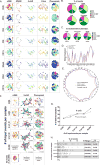
Figure 3. Basic considerations for PhenoGraph analysis
Input settings (A) and PhenoGraph data visualization (B-G), focused on CyTOF analysis of γHV68-infected lungs from either B6 or IL10KO individuals at 9 days post-infection. Data show all viable single cells, subjected to PhenoGraph in Cytofkit, which calculates the optimal amount of clusters, with data plotted on a tSNE plot. (A) Input settings to run the PhenoGraph algorithm in Cytofkit. (B,C) PhenoGraph-defined cellular distribution and clustering as defined by tSNE1 and tSNE2, colored by cluster for compiled B6 or IL10KO samples (B) or for individual mice (C). (D) PhenoGraph-based visualization on a tSNE plot, colored according to expression of lineage markers demonstrates cell clustering and varied scaling. (E,F) PhenoGraph visualization with clusters colored by phenotype in either compiled B6 or IL10KO samples (E) or for individual mice (F), with cell populations defined based on basic phenotypic markers according to the key. (G) Comparison of three sequential PhenoGraph runs, in which the exact same 9,141 cells (from individual B6 #3) were subjected to PhenoGraph, visualized by CD45 (left 3 plots) or by cluster ID (right 3 plots). Numbers identify the physical location of PhenoGraph-defined clusters. Data from virus-infected lungs (B6, n=5; IL10KO, n=4 mice).
Figure 4
Figure 4. Basic considerations for X-shift analysis
Input settings (A-E) and X-shift visualization (F-G), focused on CyTOF analysis of γHV68-infected lungs from either B6 or IL10KO individuals at 9 days post-infection. Data show all viable single cells, subjected to X-shift in the VorteX graphical environment, which calculates the optimal amount of clusters, with data plotted on a force-directed layout. Input settings to run X-shift for dataset import (A) and clustering settings (B). X-shift defined clustering is depicted as a function of the number (k) of nearest neighbors tested, which can be used to calculate elbow point (C-D). The boundaries of the linear phase, switch point, and exponential phase are indicated. (E-G) The force-directed layout curated by VorteX (E), and modified in Gephi (F-G), shows all 45 unique clusters identified at the K=20 switch point, colored by cluster ID (F) or by phenotype (G). Data from virus-infected lungs (B6, n=5; IL10KO, n=4 mice).
Figure 5
Figure 5. Basic considerations for SPADE analysis
Input settings (A) and SPADE visualization (B-G), focused on CyTOF analysis of γHV68-infected lungs from either B6 or IL10KO individuals at 9 days post-infection. Data show all viable single cells, subjected to the Spanning-tree Progression Analysis of Density-normalized Events (SPADE) algorithm that clusters cells with similar protein expression levels into a customizable hierarchy. Input settings to run SPADE within Cytobank (A). All of the events organized into a SPADE tree, colored by CD45 expression, using either a target of 200 nodes (default setting, B) or 45 nodes (X-shift informed, C-E). (C-D) depict a SPADE tree that has been manually modified by the user in Cytobank (C-D). (E) An independent SPADE analysis created from the same dataset using identical settings to panels C-D. (F) SPADE trees colored by CD45 generated based on clustering using either 10 lineage markers (left) or 35 markers (right), comparing SPADE trees with an X-shift defined optimal number of nodes (top row; 89 nodes for 10 lineage markers, 45 nodes for 35 marker clustering) with a 200 target node tree (bottom row; default Cytobank setting). (G) Visualization grid of SPADE trees, with data organized according to marker expression (rows) relative to individuals (columns). (H) Identification of cellular populations identified by the SPADE tree for individual B6 #1, with phenotype-based cell populations as identified. Histogram overlays depict a user-defined parameter whose expression bifurcates between parent and daughter. Data from virus-infected lungs (B6, n=5; IL10KO, n=4 mice).
Figure 6
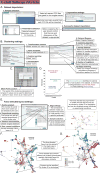
Figure 6. Basic considerations for Citrus analysis
Input settings (A) and Citrus visualization (B-K), focused on CyTOF analysis of γHV68-infected lungs from either B6 or IL10KO individuals at 9 days post-infection. Data show all viable single cells, subjected to the Citrus (cluster identification, characterization, and regression) algorithm that hierarchically clusters cells and identifies statistically significant biological differences between two or more parameters. (A) Input settings to run Citrus within Cytobank. (B) Citrus-generated model error rate plot, which defines cross validation rate and feature false discovery rate for three different models of statistical stringency (cv.min, cv.1se, cv.fdr.constrained). Vertical dotted lines were added to better illustrate how many model features were identified by each model. (C-E) Model error rate plot (left) and radial hierarchy tree colored by CD45 expression (right), comparing different input settings (alternate setting identified by asterisk) for Citrus analysis, using (C) randomized group assignment, (D) reduced input cell number (5,000 input cells/sample), or (E) reduced minimum cluster size (1%). (F) Citrus-defined radial hierarchical plot for optimized Citrus settings (panel B), shaded according to the statistical significance of three different models. (G) Citrus-defined radial hierarchical plot colored by CD45 expression, with a magnified section of the tree to better illustrate node connections. (H) Citrus-defined radial hierarchical plot shaded by statistical significance according to three different models (identical to panel F, included for comparison). (I) A Citrus-defined vertical hierarchical tree, colored by CD45 expression, generated manually from panel G. Gray cluster, identified by asterisk, and labeled <5% indicates a “ghost daughter” whose abundance is less than 5% and is therefore is excluded from the hierarchical tree. Note that asterisk in this case denotes manual inclusion of this population, not statistical significance. (J) A Citrus-defined vertical hierarchical tree, shaded by statistical significance according to three different models. (K) Illustration of parent-daughter relationships in a Citrus tree, identifying markers whose expression bifurcates between daughters. Data from virus-infected lungs (B6, n=5; IL10KO, n=4 mice).
Figure 7
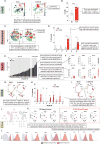
Figure 7. Comparison of data visualization, cellular identification and reproducibility across CyTOF algorithms
CyTOF analysis of γHV68-infected lungs from either B6 or IL10KO individuals harvested at 9 days post-infection. (A) Direct cross-comparison of data visualization across multiple phenotypic markers (rows), comparing different algorithms (columns), including plots shown in previous figures. (B) Quantitation of the percent of events identified as different cell phenotypes, comparing viSNE/Boolean gating, SPADE, X-shift and PhenoGraph. (C) Comparison of the number of clusters/nodes identified according to each phenotype, comparing X-shift, PhenoGraph and SPADE. (D-E) Comparison of CD4 T cell clusters/nodes identified as significantly increased in IL10KO mice, depicting (D) median expression values or (E) a phenotype network identifying parameters that were positive (defined as higher than the average expression for all events). (F-H) Analysis of the impact of input cell number per sample on data visualization across algorithms, depicting (F) data visualization, (G) cluster number (in X-shift and PhenoGraph), and (H) distribution of cluster frequencies (in PhenoGraph). Data from virus-infected lungs (B6, n=5; IL10KO, n=4 mice).
Figure 8
Figure 8. Investigating cellular abundance by viSNE, PhenoGraph, X-shift, SPADE, and Citrus algorithms
CyTOF analysis of γHV68-infected lungs from either B6 or IL10KO individuals harvested at 9 days post-infection. Data show all viable single cells, subjected to the various algorithms, and include examples demonstrating insights obtained across algorithms. (A-B) viSNE analysis showing viSNE plots for individuals B6 #1 and IL10KO #1 colored according to CD4 expression. The CD4+ T cell island was visually identified as one notable change between B6 and IL10KO mice, with this population manually gated within Cytobank, to (B) define the frequency of CD4 T cells across all individuals. (C-D) PhenoGraph analysis of B6 and IL10KO mice identified 29 clusters, colored by cluster ID and plotted according to tSNE1, 2, identified multiple clusters with apparent changes between groups. (D) Statistical analysis of all PhenoGraph defined clusters identified 2 of 29 clusters that were statistically significantly different between B6 and IL10KO mice. (E-F) X-shift analysis of B6 and IL10KO mice identified 45 clusters of cells, with each cluster comprised of different frequencies of cells from either B6 or IL10KO individuals (E). (F) The proportion of events contributed by individual mice within the top 6 most enriched clusters in either B6 or IL10KO mice identified both statistically significant clusters and clusters prominently driven by a single individual. (G-I) SPADE analysis, including a comparison of SPADE trees for B6 #1 and IL10KO#1 mice identified nodes that appear visually discrepant between these groups (G). (H) Analysis of node frequency across individuals identified 7 nodes that were statistically significantly increased in IL10KO mice, with statistically significant nodes identified on SPADE trees for B6#1 and IL10KO#1 (I). (J-L) Citrus analysis of cluster abundance identified multiple clusters that are either B6 or IL10KO biased (J), with analysis of cluster frequency across individuals (K). (L) The cellular phenotype of cluster #82243, defined by analysis of selected, Citrus-generated histogram overlays. Individual symbols on all plots identify values from individual mice. All data from optimized algorithm settings in Figs. 2–6. Statistical analysis was performed using unpaired t-test, with statistical analyses subjected to multiple testing correction and statistical significance identified as follows: p<0.05 (*), p<0.01 (**), p<0.001 (***), p<0.0001 (****).
Figure 9
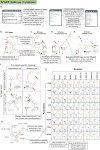
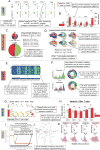
Figure 9. Investigating changes in cellular expression by viSNE, PhenoGraph, X-shift, SPADE, and Citrus algorithms
CyTOF analysis of γHV68-infected lungs from either B6 or IL10KO individuals harvested at 9 days post-infection. Data show all viable single cells, subjected to the various algorithms, and include examples demonstrating insights obtained across algorithms. (A-B) viSNE-driven analysis of CD4 T cell phenotypes, with viSNE plots displaying gated CD4+ T cells characterized for expression across 5 markers that visually appeared to be different between B6 and IL10KO mice (A). (B) The raw median intensity values for five cellular markers in CD4+ T cells, quantified by FlowJo, plotted for all individuals with statistical significance as indicated. (C-D) PhenoGraph analysis of CD4 T cell subsets, identified 6 subsets of CD4 T cells with varied frequencies between B6 and IL10KO mice (depicted by pie chart). (D) Focused analysis of 3 PhenoGraph-defined clusters, obtained from a portion of the PhenoGraph-defined tSNE map (Fig. 3). Cluster boundaries are based on PhenoGraph, colored according to expression of 6 user-identified markers. (E-F) X-shift analysis of cluster #520, an IL10KO biased cluster, characterized by phenotypic barcodes to define the average expression and expression across the first 10 events in this cluster. (F) Line graphs of median expression values for two clusters revealed to be significantly increased in IL10KO mice. Manually generated phenotype infographics reveal both core and unique accessory phenotypes of each cluster. (G-H) SPADE analysis of two CD4+ T cell nodes shown to increase in IL10KO mice, characterizing changes in expression across 5 user-defined parameters (parallel to panel A). (H) Quantitation of median intensity value across multiple parameters, characterizing expression in SPADE node #1 for each individual. (I) Citrus analysis of medians identified a cv.min predictive model with 10% cross-validation error, characterized by four model features whose expression increased in IL10KO mice. Proteins with altered expression were manually identified on a radial Citrus hierarchy tree (J), with median expression between groups quantified and visualized by Citrus-generated histogram overlays (K). Individual symbols on all plots identify values from individual mice. Data from optimized algorithm settings in Figs. 2–6. Statistical analysis was performed using unpaired t-test, with statistical analyses subjected to multiple testing correction and statistical significance identified as follows: p<0.05 (*), p<0.01 (**), p<0.001 (***), p<0.0001 (****).
Figure 10
Figure 10. Population structure analysis using SPADE, X-shift and PhenoGraph
CyTOF analysis of γHV68-infected lungs from either B6 or IL10KO individuals harvested at 9 days post-infection. Data show all viable single cells, subjected to CyTOF analysis algorithms that stratify all events into discrete subsets. (A) SPADE definition of node frequency across all events defined altered frequencies and prominence between B6 and IL10KO groups, with statistically significant changes identified in Fig. 8 annotated by red arrows. (B) X-shift defined frequencies of cell types, and subsets (identified by cluster number), revealed both altered frequencies of cell types and changes in subset distribution within each cell type. (C) PhenoGraph defined clustering relationships, visualized by dendrogram analysis, identified dynamic relationships between cell clusters in B6 (left) and IL10KO (right) mice. Phenotypic markers that showed wide variation, and appeared to correlate with changing clustering relationships are identified by red boxes. Data from virus-infected lungs (B6, n=5; IL10KO, n=4 mice).

References

    1. Bandura DR, Baranov VI, Ornatsky OI, Antonov A, Kinach R, Lou X, Pavlov S, Vorobiev S, Dick JE, Tanner SD. Mass cytometry: technique for real time single cell multitarget immunoassay based on inductively coupled plasma time-of-flight mass spectrometry. Anal Chem. 2009;81:6813–6822. - PubMed
    1. Bendall SC, Simonds EF, Qiu P, Amir el AD, Krutzik PO, Finck R, Bruggner RV, Melamed R, Trejo A, Ornatsky OI, Balderas RS, Plevritis SK, Sachs K, Pe’er D, Tanner SD, Nolan GP. Single-cell mass cytometry of differential immune and drug responses across a human hematopoietic continuum. Science. 2011;332:687–696. - PMC - PubMed
    1. Spitzer MH, Nolan GP. Mass Cytometry: Single Cells, Many Features. Cell. 2016;165:780–791. - PMC - PubMed
    1. Newell EW, Sigal N, Bendall SC, Nolan GP, Davis MM. Cytometry by time-of-flight shows combinatorial cytokine expression and virus-specific cell niches within a continuum of CD8+ T cell phenotypes. Immunity. 2012;36:142–152. - PMC - PubMed
    1. Horowitz A, Strauss-Albee DM, Leipold M, Kubo J, Nemat-Gorgani N, Dogan OC, Dekker CL, Mackey S, Maecker H, Swan GE, Davis MM, Norman PJ, Guethlein LA, Desai M, Parham P, Blish CA. Genetic and environmental determinants of human NK cell diversity revealed by mass cytometry. Sci Transl Med. 2013;5:208ra145. - PMC - PubMed

Publication types