. 2018 Feb 5;217(2):585-599.
doi: 10.1083/jcb.201706135. Epub 2017 Dec 18.

N-Glycan-dependent protein folding and endoplasmic reticulum retention regulate GPI-anchor processing

Affiliations

N-Glycan-dependent protein folding and endoplasmic reticulum retention regulate GPI-anchor processing

Yi-Shi Liu et al. J Cell Biol. .

Abstract

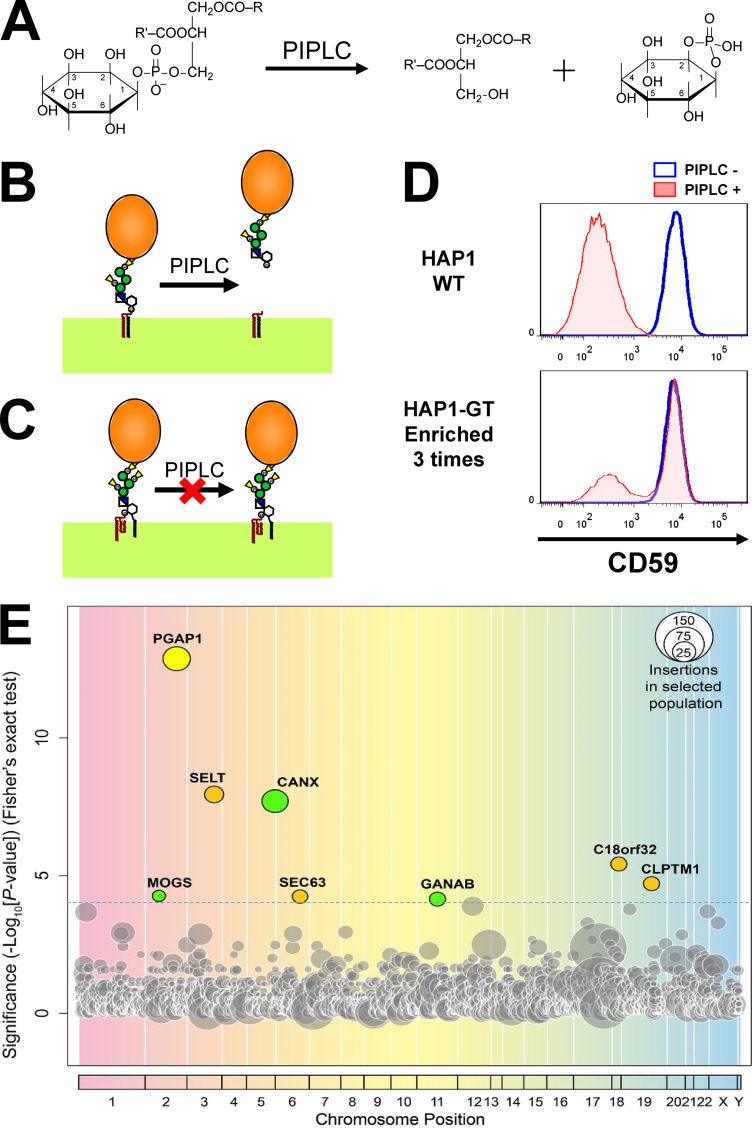
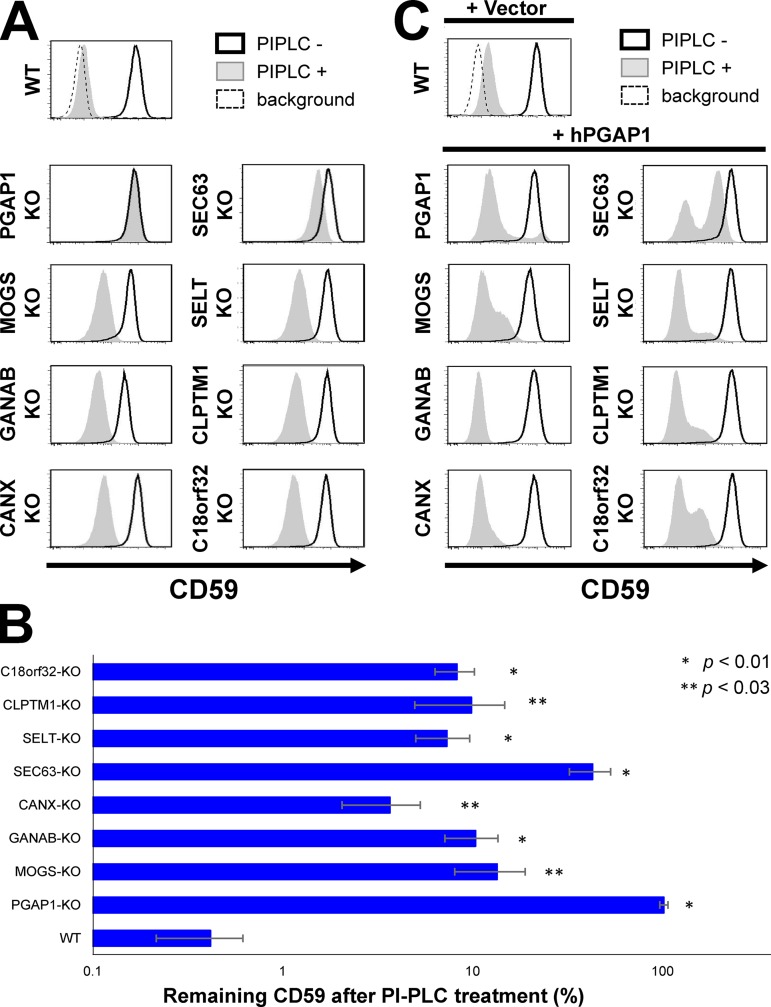
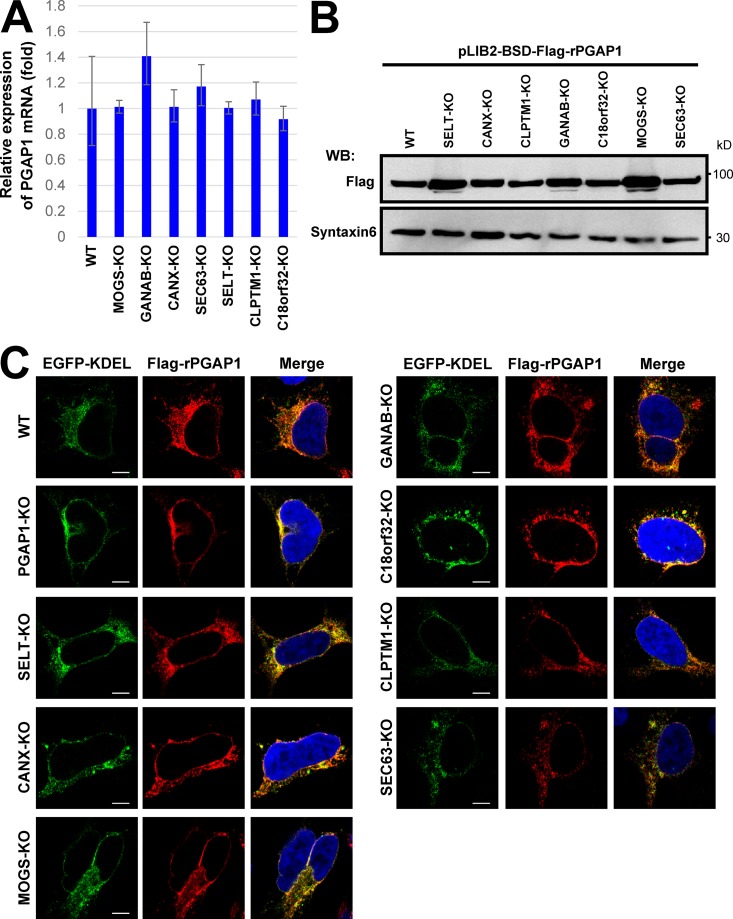
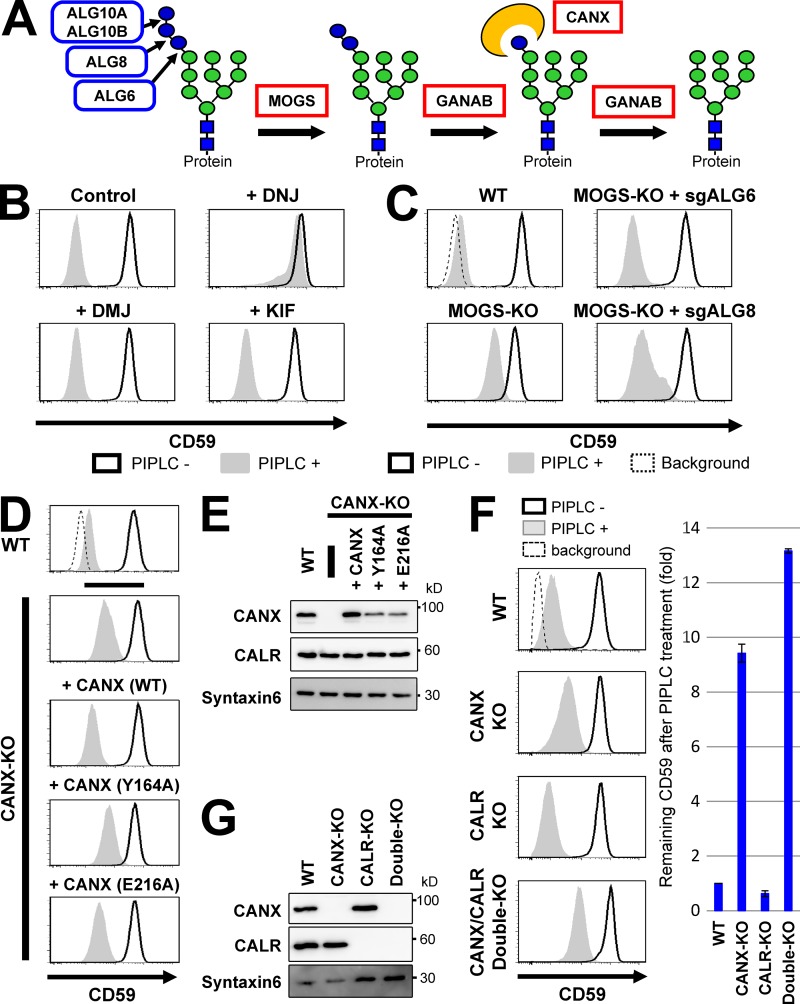
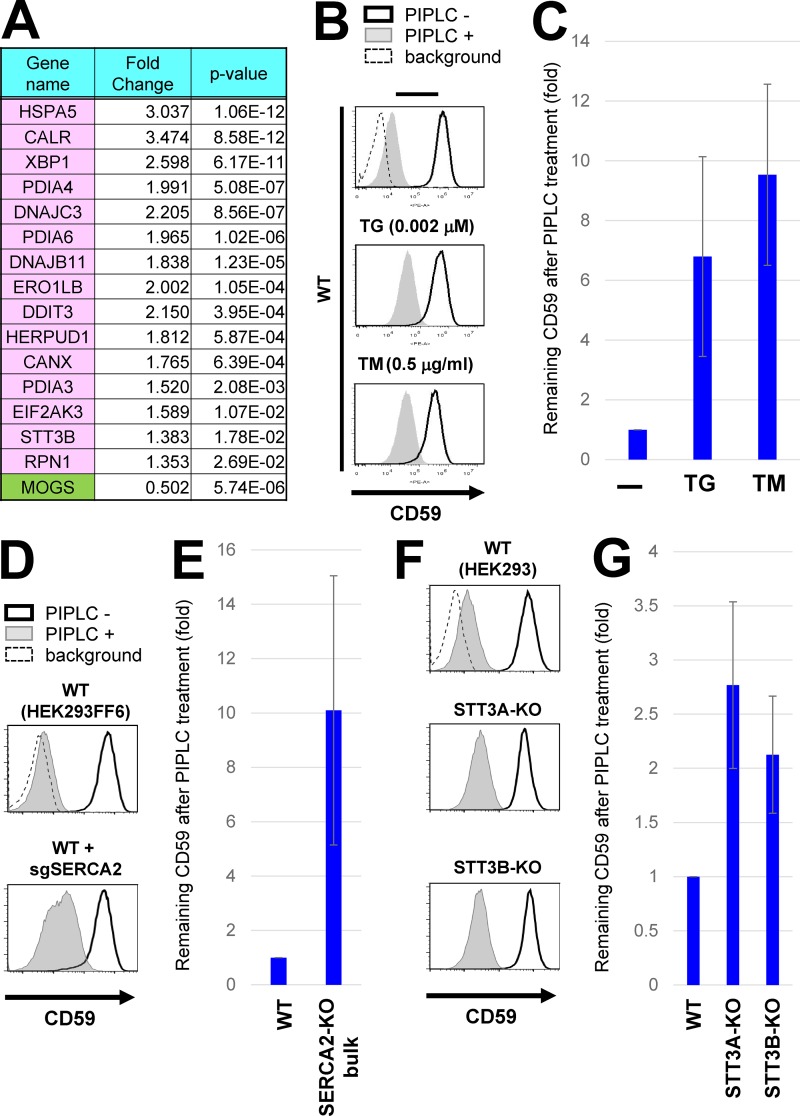
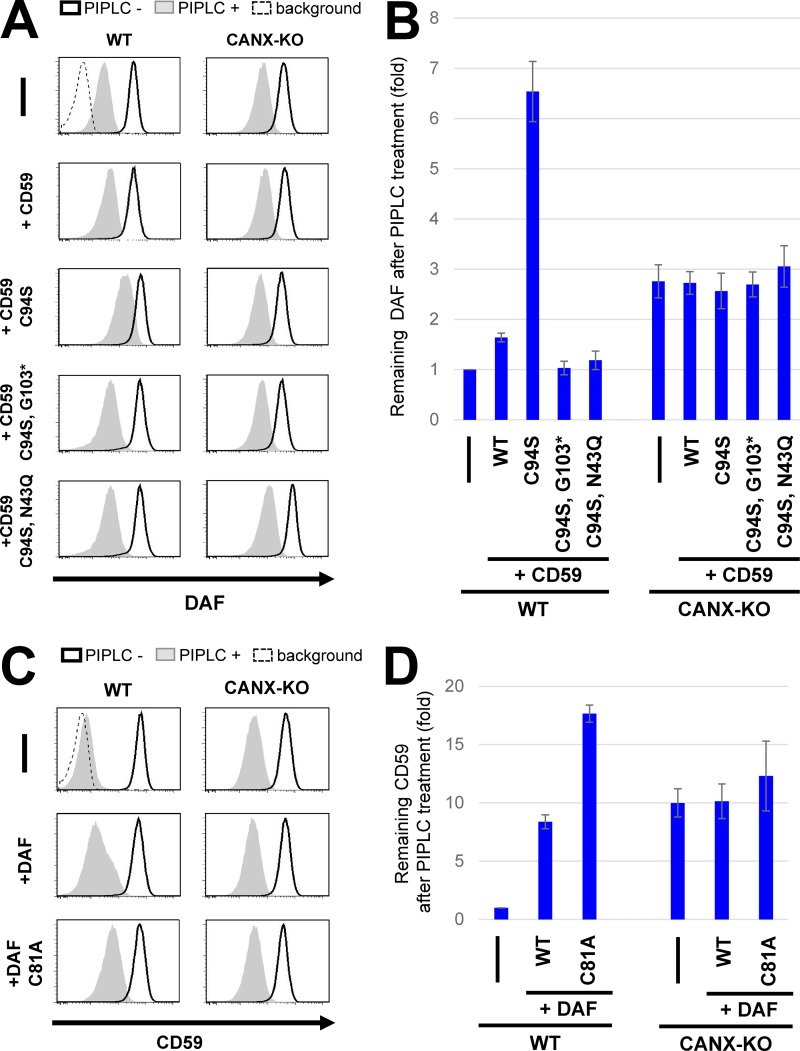
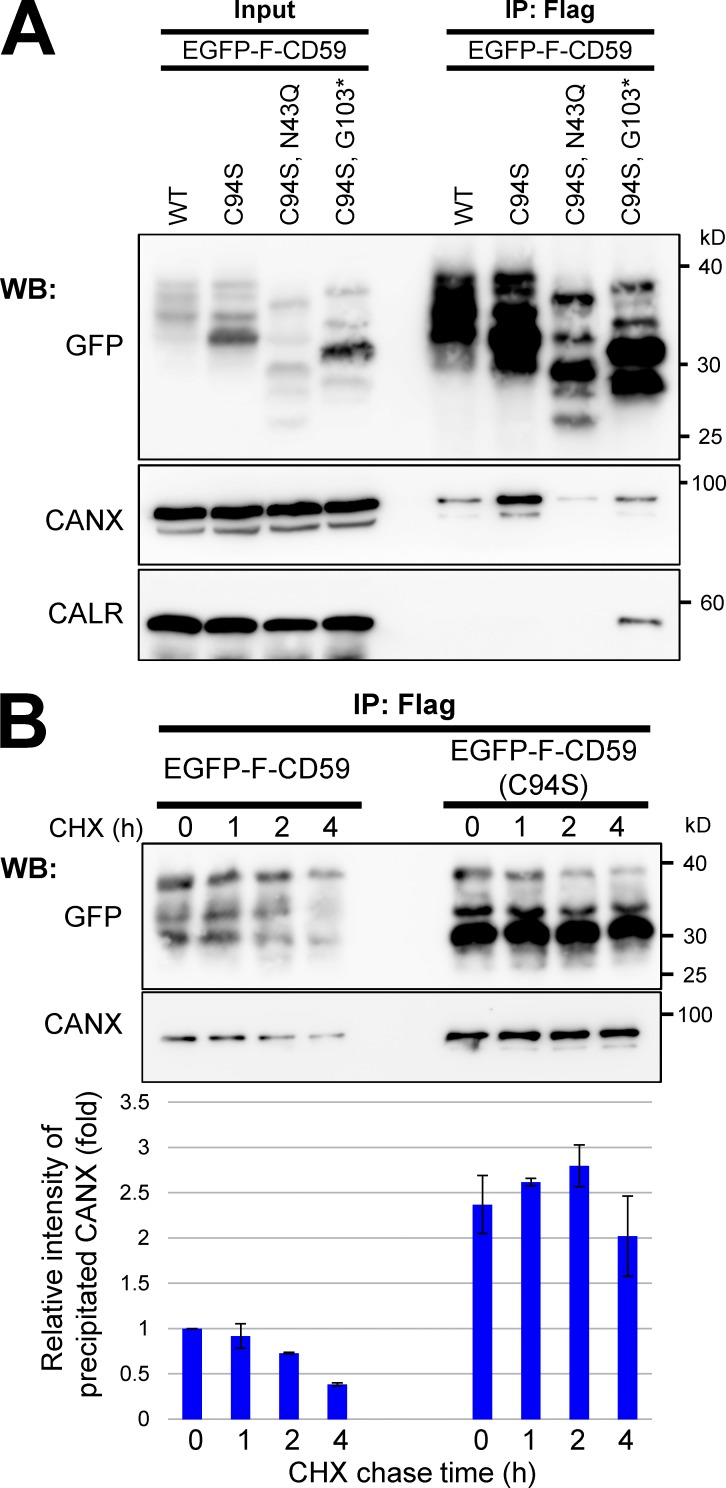
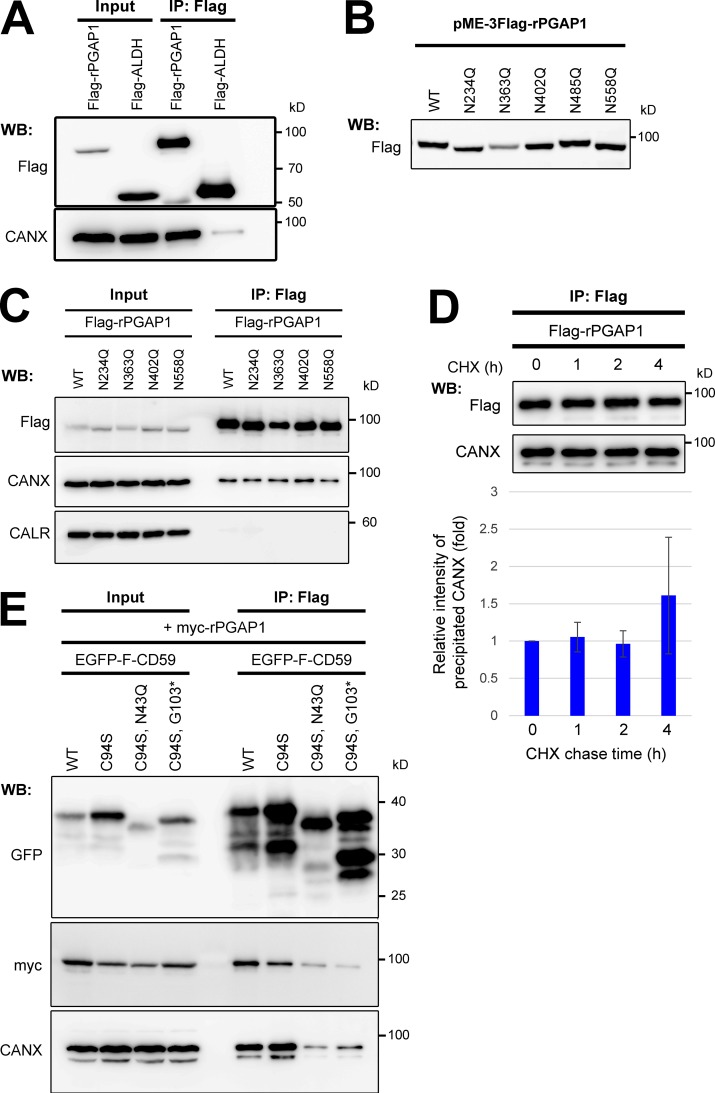
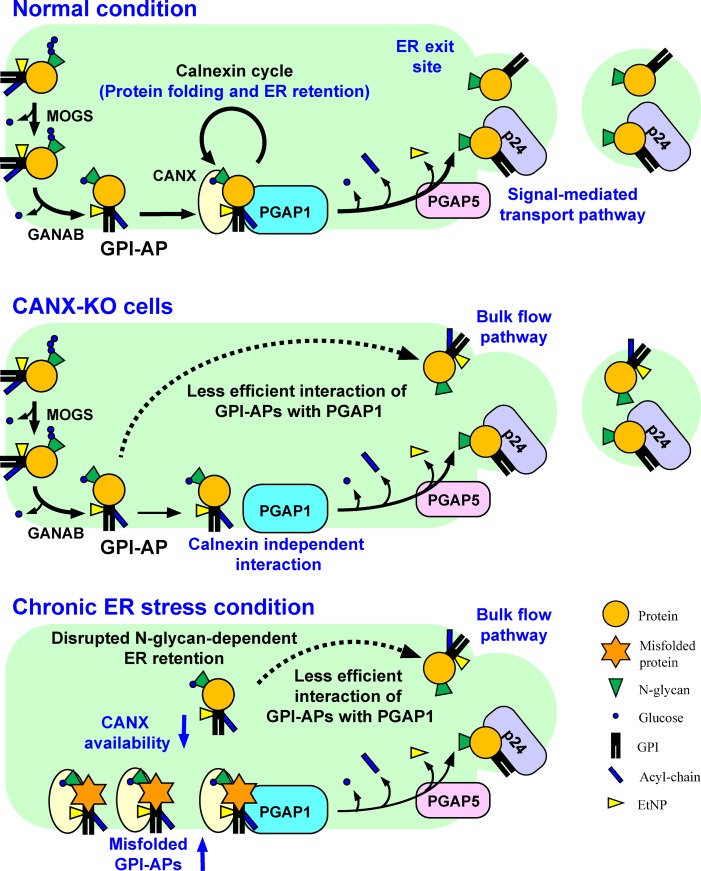
Glycosylphosphatidylinositol (GPI) anchoring of proteins is a conserved posttranslational modification in the endoplasmic reticulum (ER). Soon after GPI is attached, an acyl chain on the GPI inositol is removed by post-GPI attachment to proteins 1 (PGAP1), a GPI-inositol deacylase. This is crucial for switching GPI-anchored proteins (GPI-APs) from protein folding to transport states. We performed haploid genetic screens to identify factors regulating GPI-inositol deacylation, identifying seven genes. In particular, calnexin cycle impairment caused inefficient GPI-inositol deacylation. Calnexin was specifically associated with GPI-APs, dependent on N-glycan and GPI moieties, and assisted efficient GPI-inositol deacylation by PGAP1. Under chronic ER stress caused by misfolded GPI-APs, inositol-acylated GPI-APs were exposed on the cell surface. These results indicated that N-glycans participate in quality control and temporal ER retention of GPI-APs, ensuring their correct folding and GPI processing before exiting from the ER. Once the system is disrupted by ER stress, unprocessed GPI-APs become exposed on the cell surface.


Figures

Figure 1.
Figure 1.
Haploid genetic screens identified factors required for GPI-inositol deacylation. (A) Schematic representation of the reaction catalyzed by bacterial PIPLC. PIPLC cleaves PI. For hydrolysis, PIPLC utilizes the hydroxyl group at the 2-position of the inositol ring, producing diacylglycerol and inositol-1,2-cyclic phosphate. (B) Mature GPI-APs were cleaved and released from the plasma membrane after PIPLC treatment. (C) When the 2-position of the inositol ring on GPI-AP was modified with an acyl chain, PIPLC does not react with the GPI-APs. (D) Flow cytometric analysis of a GPI-AP, CD59, in parental HAP1 cells (WT) and in the bulk population of mutagenized HAP1 cells (HAP1-GT) that were enriched three times. The red shading and blue line indicate with and without PIPLC treatment, respectively. (E) Significance of the enrichment of gene trap insertions in enriched PIPLC-resistant cells compared with in nonselected cells plotted as a bubble plot. The horizontal line shows the chromosomal position of the genes, and the vertical line the significance of enrichment of each gene (p-values). The size of the bubble shows the number of independent insertion sites in enriched cell populations. Genes significantly enriched in the PIPLC-resistant population (P < 0.0001) are colored. Yellow, PGAP1 encoding GPI-inositol deacylase; green, genes for glucose trimming and calnexin; brown, other genes.
Figure 2.
Figure 2.
KO of genes identified by screening in HEK293 cells. (A) Genes identified in a screening for GPI-APs’ resistance to PIPLC were knocked out by the CRISPR-Cas9 system. KO of the genes is confirmed in Fig. S1. The KO cells were treated with or without PIPLC, stained with anti-CD59 antibody, and analyzed by flow cytometry. Shaded areas indicate cells treated with PIPLC, solid lines indicate cells without PIPLC treatment, and dashed lines show background. (B) Percentages of CD59 remaining after PIPLC treatment of the KO cell lines are plotted. Values are means ± SD of three independent measurements, with p-values (two-tailed Student’s t test) shown on the right. (C) Overexpression of human PGAP1 in the gene KO cell lines rescued the phenotype. Human PGAP1 plasmid was transfected into the KO cells. Cells were selected with antibiotics, treated with or without PIPLC, and then stained with anti-CD59 antibody and analyzed by flow cytometry. The incomplete rescue was a result of the presence of cells showing antibiotics resistance but not expressing PGAP1.
Figure 3.
Figure 3.
Expression, protein stability, and localization of PGAP1 were not changed in gene KO cell lines. (A) Quantitative PCR analysis of PGAP1 mRNA levels in WT HEK293FF6, MOGS-KO, GANAB-KO, CANX-KO, SEC63-KO, SELT-KO, CLPTM1-KO, and C18orf32-KO cells. GAPDH values were used to normalize the data. The bars represent RQ (relative quantification) values ± RQmax and RQmin (error bars) of triplicate samples. (B) Cells stably expressing Flag-tagged rat PGAP1 (Flag-rPGAP1) were lysed and analyzed by Western blotting (WB). Proteins were detected with anti-Flag antibodies. Syntaxin 6 was used as the loading control. (C) Cells stably expressing Flag-tagged rat PGAP1 were transfected with GFP-KDEL and immunostained with an anti-Flag antibody. Images were collected using confocal microscopy. DAPI staining was shown as blue in merged images. Bars, 5 µm.
Figure 4.
Figure 4.
Glucose trimming from N-glycans and calnexin affected GPI-inositol deacylation. (A) Schematic of glucose trimming after protein N-glycosylation. ALG6, ALG8, and ALG10 are enzymes that add three glucoses (blue circles) one by one to the lipid-linked oligosaccharide Man9GlcNAc2 structure. MOGS and GANAB are α-glucosidase I and α-glucosidase II enzymes, removing the first and the other two glucose from N-glycans, respectively. CANX is calnexin, recognizing and binding to the monoglucosylated N-glycan structure. Green circles, mannose; blue squares, GlcNAc. (B) HEK293FF6 cells were treated with DNJ, an α-glucosidase inhibitor, or DMJ or KIF, α1,2-mannosidase inhibitors, for 11 d. Flow cytometry was used to analyze surface CD59 in cells with or without PIPLC treatment as described in Fig. 2 A. (C) MOGS-KO cells were transfected with plasmids expressing single guide (sg) ALG6 or sgALG8 RNAs to knock out those genes. Plasmid-positive cells were sorted and cultured for >10 d after transfection. Flow cytometry analysis of the surface CD59 in cells with or without PIPLC treatment was performed as described in Fig. 2 A. (D) Resistance of GPI-APs against PIPLC in CANX-KO cells was rescued by expression of WT but not lectin activity–deficient calnexin. WT cells and CANX-KO cells stably expressing WT CANX or mutant CANXs (Y164A or E216A) were treated with or without PIPLC. After treatment, cells were stained with anti-CD59 antibodies and analyzed by flow cytometry as described in Fig. 2 A. (E) Lysates of cells in D were analyzed by Western blotting. CANX and CALR were detected. Syntaxin 6 was used as the loading control. (F and G) WT, CANX-KO, CALR-KO, and CANX/CALR double-KO cells were treated with or without PIPLC. Flow cytometry analysis of surface CD59 was performed (F) as described in Fig. 2 A. CD59 levels remaining after PIPLC treatment are plotted. The remaining CD59 value in WT cells was set as 1. Relative values were calculated and are shown as means ± SD from three independent experiments. Lysates prepared from cells were analyzed by Western blotting (G).
Figure 5.
Figure 5.
Chronic ER stress induced exposure of inositol-acylated GPI-APs on the cell surface. (A) Gene expression was analyzed in WT and MOGS-KO cells using RNA-seq analyses. Among genes altered in MOGS-KO cells compared with WT cells, genes categorized in the “Protein processing in endoplasmic reticulum” in the KEGG pathway were shown in pink (up-regulation) or green (down-regulation; see Fig. S4). The MOGS gene was significantly down-regulated in the MOGS-KO cells, probably as a result of nonsense-mediated mRNA decay. (B) WT HEK293FF6 cells were treated with or without the ER stress inducer TG (0.002 µM; middle) or TM (0.5 µg/ml; bottom) for 10 d. PIPLC-treated or -untreated cells were stained with anti-CD59 antibodies. Surface CD59 was detected by flow cytometry as described in Fig. 2 A. (C) CD59 levels remaining after PIPLC treatment are plotted. (D and E) WT HEK293FF6 cells were transfected with plasmids expressing sgSERCA2 sequences to knock out the gene. Plasmid-positive cells were sorted and cultured for 10 d after transfection. WT HEK293FF6 cells and cells with bulk KO of SERCA2 were treated with or without PIPLC. Surface CD59 was analyzed by flow cytometry (D). CD59 remaining after PIPLC treatment in SERCA2-KO cells is plotted in E. The value of remaining CD59 in WT cells was set as 1. (F and G) WT HEK293, STT3A-KO, and STT3B-KO cells were treated with or without PIPLC. Surface CD59 was analyzed by flow cytometry (F). CD59 remaining after PIPLC treatment is plotted in G. In all graphs, the remaining CD59 value in untreated cells was set as 1. Relative values were calculated and are shown as means ± SD from three independent experiments.
Figure 6.
Figure 6.
Overexpression of misfolded GPI-APs decreased deacylation efficiency of endogenous GPI-APs in WT but not CANX-KO cells. (A) WT HEK293FF6 or CANX-KO cells stably expressing WT EGFP-F–CD59, mutant CD59 (C94S and misfolded CD59), misfolded CD59 lacking GPI (C94S and G103stop*), or misfolded CD59 lacking an N-glycan (C94S and N43Q) were treated with or without PIPLC. After treatments, cells were stained for endogenous DAF and analyzed by flow cytometry. (B) DAF levels remaining after PIPLC treatment were plotted. The value for remaining DAF in WT cells without any exogenous expression was set to 1. (C) WT HEK293FF6 or CANX-KO cells stably expressing WT EGFP-F–DAF or mutant DAF (C81A, misfolded DAF) were treated with or without PIPLC. After treatment, cells were stained for endogenous CD59 and analyzed by flow cytometry. (D) CD59 levels remaining after PIPLC treatment are shown. The remaining CD59 value in WT cells without any exogenous expression was set to 1. Relative values were calculated and are represented as means ± SD from three independent experiments.
Figure 7.
Figure 7.
Calnexin interacted with GPI-APs dependent on its N-glycan and GPI. (A) Cells were transiently transfected with WT EGFP-F–CD59, CD59 mutants (C94S and misfolded CD59), misfolded CD59 lacking GPI (C94S and G103stop*), or misfolded CD59 lacking an N-glycan (C94S and N43Q), and then they were lysed with lysis buffer containing 1% NP-40. The lysates were subjected to immunoprecipitation (IP) with anti-Flag beads. The precipitated proteins were released from the beads using Flag peptides. The input (10% of total protein) and immunoprecipitated fractions were analyzed by immunoblotting with the indicated antibodies. (B) Cells stably expressing EGFP-F–CD59 or –CD59 (C94S) were cultured. At the indicated time after protein synthesis was stopped by addition of CHX, EGFP-F–CD59 was precipitated, and coprecipitated calnexin was detected. The coprecipitated calnexin with WT CD59 at time 0 was set to 1. Relative values were calculated and are represented as means ± SEM from three independent experiments. WB, Western blot.
Figure 8.
Figure 8.
PGAP1 associated with calnexin and GPI-APs. (A) Cells were transfected with plasmids expressing Flag-tagged rat PGAP1 (Flag-rPGAP1) or ALDH (Flag-ALDH) and then lysed with lysis buffer containing 1% digitonin and subjected to immunoprecipitation with anti-Flag beads. The input (10% of total protein) and immunoprecipitation (IP) fractions were analyzed by Western blotting (WB). (B) Asparagine (N) residues on potential N-glycosylation sites of rat PGAP1 were each replaced with glutamine (Q). Cells were transfected with plasmids expressing the mutant PGAP1, and Flag-rPGAP1 was then detected by immunoblotting. (C) Cells transfected with plasmids expressing Flag-rPGAP1 or N-glycan–deficient Flag-rPGAP1 (N234Q, N363Q, N402Q, or N558Q) were lysed with lysis buffer containing 1% digitonin. Flag-rPGAP1 was precipitated with anti-Flag beads. The input (10% of total protein) and immunoprecipitated fractions were analyzed by Western blotting. (D) Cells stably expressing Flag-rPGAP1 were cultured. At the indicated time after protein synthesis was stopped by addition of CHX, Flag-rPGAP1 was precipitated, and coprecipitated calnexin was detected. The coprecipitated calnexin with Flag-rPGAP1 at time 0 was set to 1. Relative values were calculated and are represented as means ± SEM from three independent experiments. (E) WT HEK293FF6 cells stably expressing WT EGFP-F–CD59 or CD59 mutants (C94S, C94S/N43Q, or C94S/G103stop*) were transfected with plasmids expressing myc-tagged rat PGAP1 (myc-rPGAP1). Cells were lysed in lysis buffer containing 1% digitonin and subjected to immunoprecipitation. The input (10% of total protein) and immunoprecipitation fractions were analyzed by Western blotting.
Figure 9.
Figure 9.
Summary models for folding and processing of GPI-APs regulated by calnexin and ER homeostasis. Top: under normal conditions, N-glycans and GPI are transferred to newly synthesized GPI-APs. The glucose residues on N-glycans are trimmed by α-glucosidases I and II, resulting in a Glc1Man9GlcNAc2 structure, which is recognized by calnexin. Calnexin assists protein folding and facilitates GPI-inositol deacylation by PGAP1 through the temporal ER retention of GPI-APs. Calnexin also interacts with PGAP1 to increase the efficiency of the GPI-inositol deacylation. Once the protein portion of each GPI-AP is folded, calnexin dissociates from the GPI-AP, which is further remodeled by PGAP5 and efficiently incorporated into transport vesicles by a signal-mediated pathway involving p24 proteins. Middle: in CANX-KO cells, GPI-APs cannot retain in the ER and decrease the efficient interaction with PGAP1, resulting in transport of some GPI-APs without processing. Calnexin-independent GPI-inositol deacylation also exists. Bottom: under chronic ER stress conditions, misfolded GPI-APs accumulate in the ER and occupy the calnexin and PGAP1. Availability of calnexin and PGAP1 is therefore decreased, and normal GPI-APs without processing leak into transport vesicles through a bulk flow pathway, resulting in expression of inositol-acylated GPI-APs on the cell surface.

Similar articles

Cited by

References

    1. Aebi M. 2013. N-linked protein glycosylation in the ER. Biochim. Biophys. Acta. 1833:2430–2437. 10.1016/j.bbamcr.2013.04.001 - DOI - PubMed
    1. Anders S., and Huber W.. 2010. Differential expression analysis for sequence count data. Genome Biol. 11:R106. - PMC - PubMed
    1. Anders S., Pyl P.T., and Huber W.. 2014. HTSeq — A Python framework to work with high-throughput sequencing data. Bioinformatics. 10.1093/bioinformatics/btu638 - DOI - PMC - PubMed
    1. Blomen V.A., Májek P., Jae L.T., Bigenzahn J.W., Nieuwenhuis J., Staring J., Sacco R., van Diemen F.R., Olk N., Stukalov A., et al. . 2015. Gene essentiality and synthetic lethality in haploid human cells. Science. 350:1092–1096. 10.1126/science.aac7557 - DOI - PubMed
    1. Boukhzar L., Hamieh A., Cartier D., Tanguy Y., Alsharif I., Castex M., Arabo A., El Hajji S., Bonnet J.J., Errami M., et al. . 2016. Selenoprotein T Exerts an Essential Oxidoreductase Activity That Protects Dopaminergic Neurons in Mouse Models of Parkinson’s Disease. Antioxid. Redox Signal. 24:557–574. 10.1089/ars.2015.6478 - DOI - PMC - PubMed

Publication types

MeSH terms