. 2017 Dec 18;8(1):2153.
doi: 10.1038/s41467-017-01538-9.

Longitudinal intravital imaging of the femoral bone marrow reveals plasticity within marrow vasculature

Affiliations

Longitudinal intravital imaging of the femoral bone marrow reveals plasticity within marrow vasculature

David Reismann et al. Nat Commun. .

Abstract

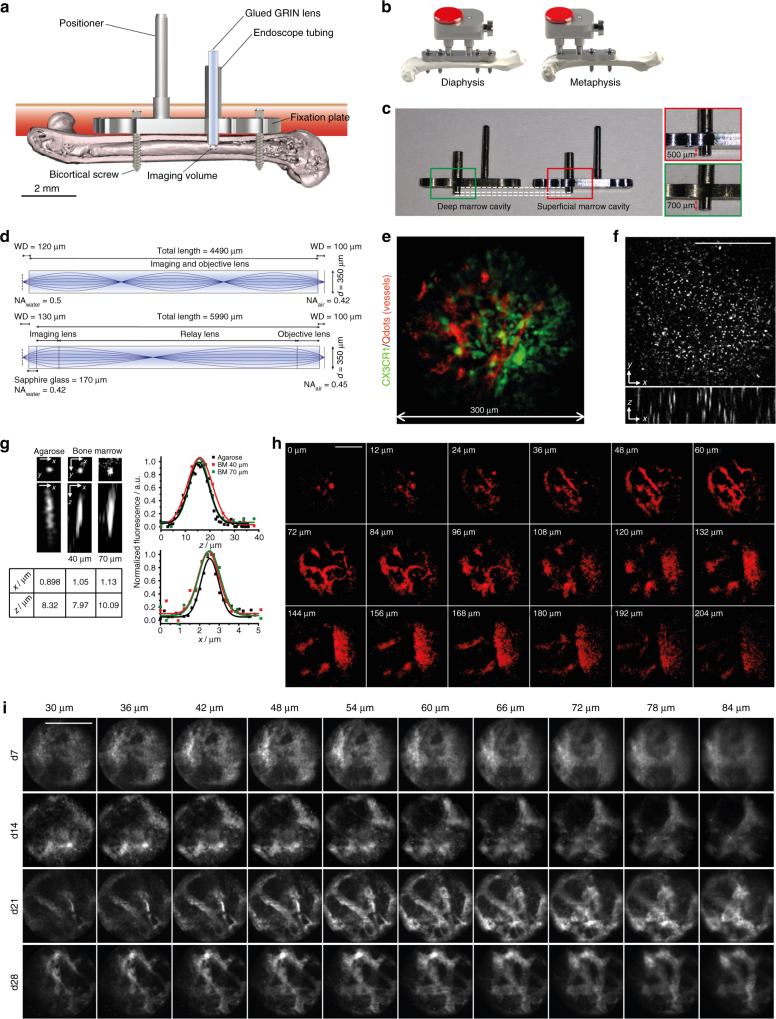
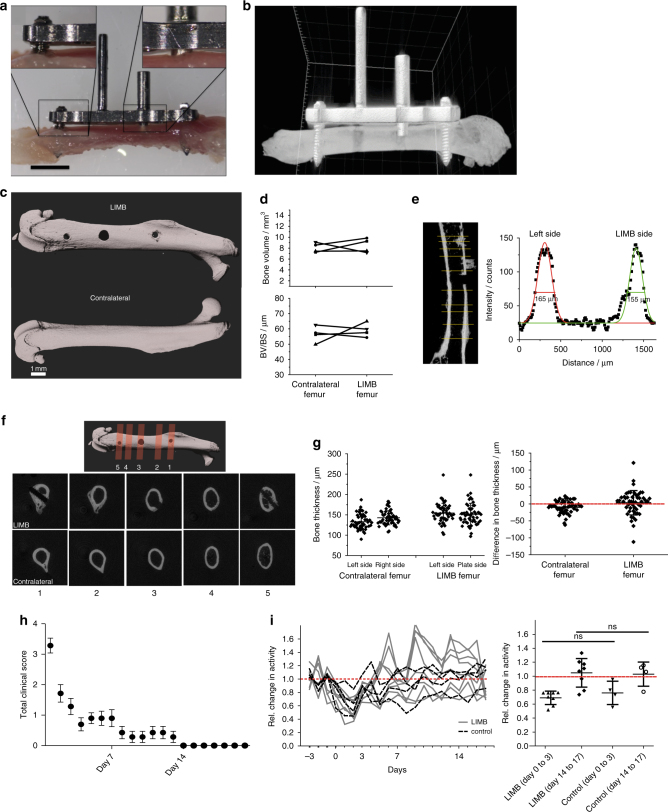
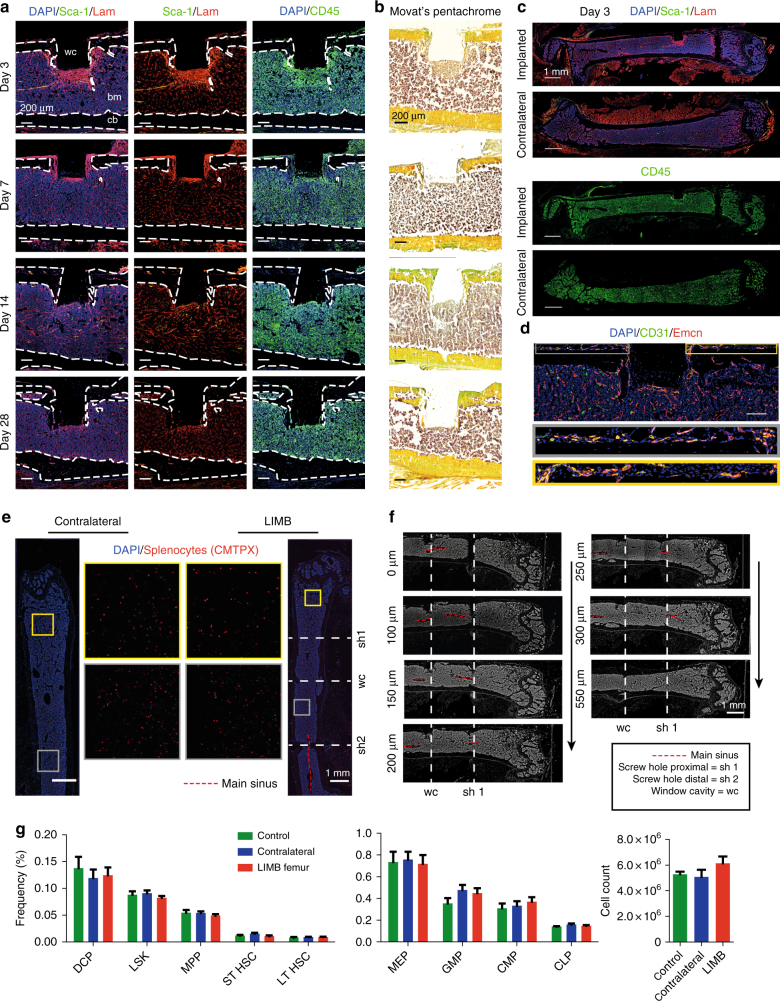
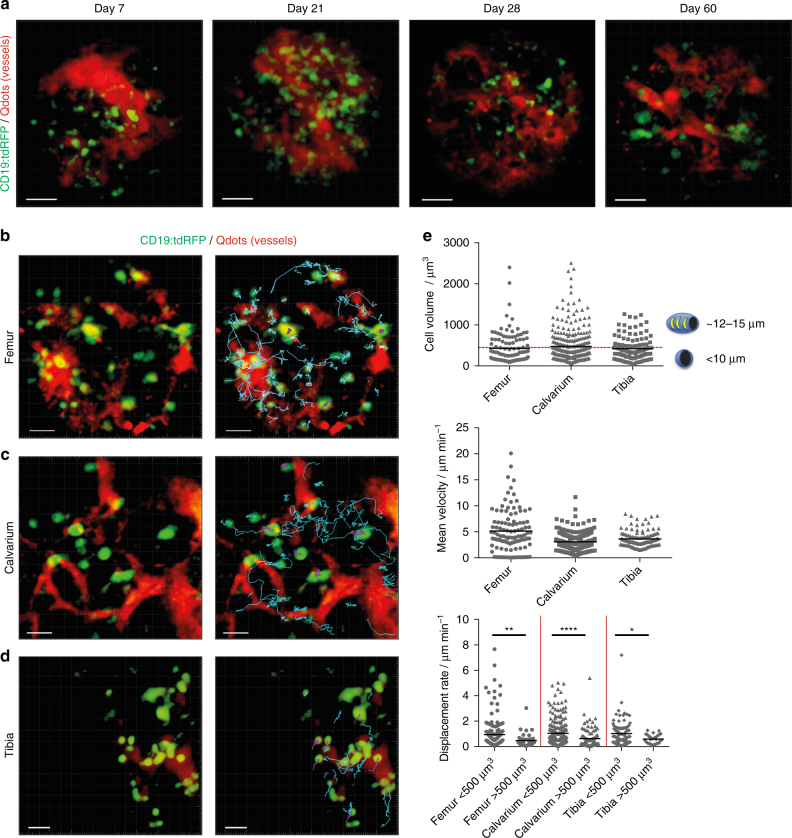
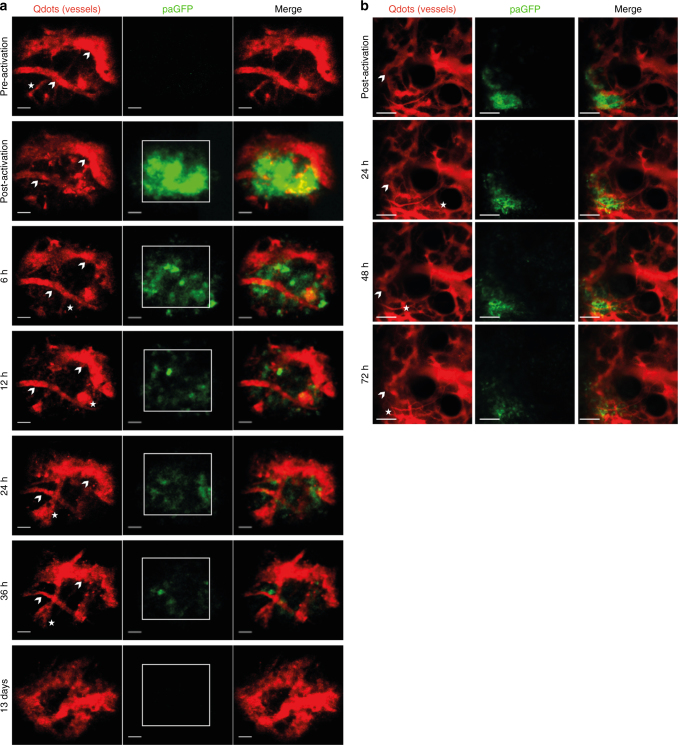
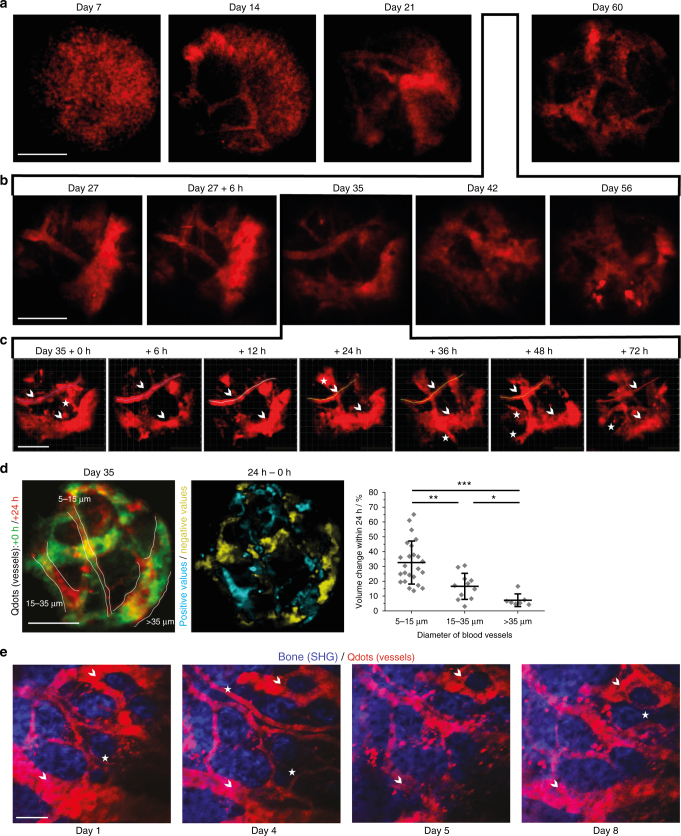
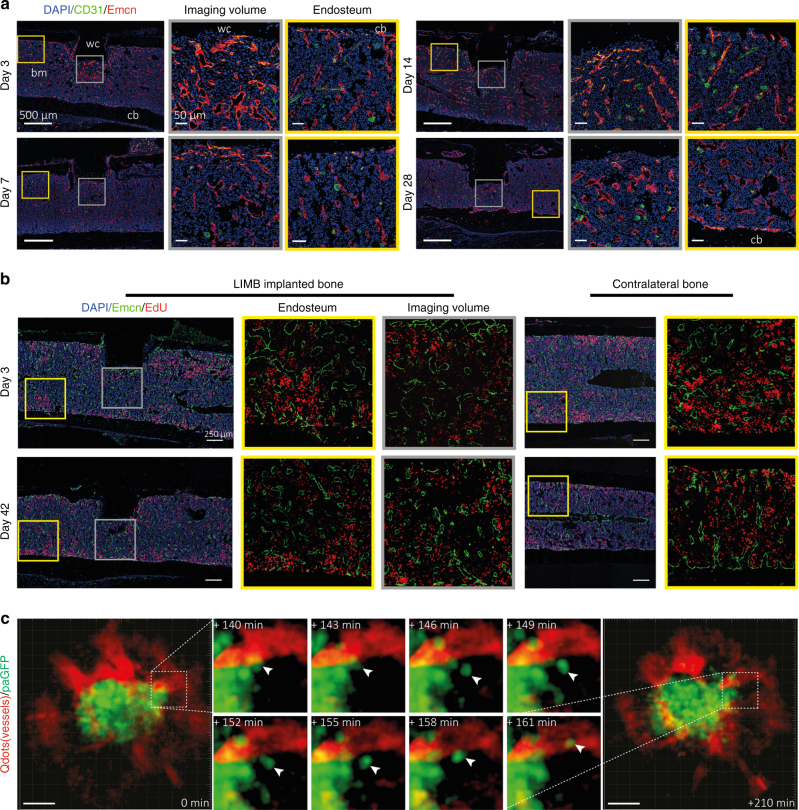
The bone marrow is a central organ of the immune system, which hosts complex interactions of bone and immune compartments critical for hematopoiesis, immunological memory, and bone regeneration. Although these processes take place over months, most existing imaging techniques allow us to follow snapshots of only a few hours, at subcellular resolution. Here, we develop a microendoscopic multi-photon imaging approach called LIMB (longitudinal intravital imaging of the bone marrow) to analyze cellular dynamics within the deep marrow. The approach consists of a biocompatible plate surgically fixated to the mouse femur containing a gradient refractive index lens. This microendoscope allows highly resolved imaging, repeatedly at the same regions within marrow tissue, over months. LIMB reveals extensive vascular plasticity during bone healing and steady-state homeostasis. To our knowledge, this vascular plasticity is unique among mammalian tissues, and we expect this insight will decisively change our understanding of essential phenomena occurring within the bone marrow.


Conflict of interest statement

R.M. and R.N. (RISystem AG, Davos, Switzerland) declare competing financial interests. The implant for longitudinal imaging will be commercialized by RISystem AG, Davos, Switzerland. The remaining authors declare no competing financial interests.

Figures

Fig. 1
Fig. 1
LIMB allows murine long bone imaging in various locations with high resolution. a Design and positioning of LIMB implant for longitudinal bone marrow imaging. The LIMB implant is fixed onto the femur using bi-cortical angle-stable screws. GRIN lens systems are placed within the endoscope tubing for imaging and sealed to ensure sterility. The positioner allows adjustment and alignment of GRIN and microscope optical axes. b In order to account for tissue heterogeneity, i.e., metaphyseal vs. diaphyseal regions, alternative LIMB designs have been developed. LIMB fixation with four screws allows higher bone stability after osteotomies. c Tubing lengths of 500 and 700 µm, respectively, allow access to either peri-cortical or deep marrow regions. d Two GRIN lens systems are used for imaging. The single GRIN lens (upper panel) combines the imaging and objective lens function and is glued into the endoscope tubing. The symmetric triple GRIN lens (lower panel) is exchangeable and a sapphire window seals the endoscope tubing. e 3D fluorescence image of the bone marrow of a CX 3 CR1:GFP mouse using the single GRIN lens (myeloid CX 3 CR1 + cells ‑ green; vasculature labeled by Qdots ‑ red). The maximum field of view is circular, with 280 µm diameter. f The PSF was measured on 100 nm beads (λ em = 605 nm, λ exc = 850 nm) in agarose, using the single GRIN lens. No significant wave-front distortions affecting the PSF are observed. g Qdots are used to estimate PSF in marrow tissue. They reveal slight resolution deterioration with increasing imaging depth. h 2D fluorescence images of Qdots-labeled femoral vasculature, 35 days post-surgery, at various z-positions between the surface of the single GRIN lens and 204 µm tissue depth. They reveal fine vascularization in the upper layers and a large blood vessel (~100 µm diameter) with emerging branches in the deep marrow. i 2D fluorescence images of femoral vasculature acquired at various depths and time points post-surgery, using the triplet GRIN lens. The tissue at the contact surface with the window is characterized by de novo micro-vascularization, i.e., granulation tissue. Its thickness varies between individuals and decreases over time after implantation. Scale bars = 100 µm
Fig. 2
Fig. 2
Effect of LIMB implantation on bone tissue, general health, and activity of the mice. a Picture of an explanted femur including the LIMB implant shows the fixation plate bridging between the angle-stable screws, thereby preventing direct contact to the bone surface/periosteum. Scale bar = 2 mm. b 3D reconstructed µCT images of a femur bearing the LIMB implant confirm no direct contact between bone and fixation plate. Shadows below the positioner are beam hardening artifacts of the high attenuation titanium alloy. c 3D reconstructed µCT images of an intact femur (lower panel) and a femur after removal of the LIMB implant (upper panel). Bone surface under the fixation plate 7 days after implantation appears similar to the bone surface of the intact femur. Bone growth is observed only around the bicortical screws. d Total bone volume (upper panel) and BV/BS (lower panel) of LIMB and contralateral femur, respectively (n = 4 mice). e Longitudinal cross-section through a µCT reconstruction of a femur after implant removal (left panel). Yellow lines represent the positions chosen to measure the bone thickness. For each position, the intensity profile was approximated with two Gaussian curves as indicated in the left graph. f 3D reconstruction of µCT data showing the planes of transverse cross-sections displayed in the lower two panels. At day 21 after implantation, calcified bone forms around the bicortical screws, but not around the endoscope tubing. Cross-section µCT images at the sites of the screws show enough space for the bone marrow tissue to connect the diaphysis with the metaphysis. g No differences in bone thickness between contralateral and LIMB femurs are measured (n = 5 mice). h Total clinical score over 3 weeks post-surgery based on behavior and appearance of the individual mice (n = 79 mice). i Physical activity of LIMB implanted mice, pre-surgery and post-surgery, and of co-housed control mice. The LIMB-implanted mice reach their pre-surgical activity level within the same time as sham-treated controls (right graph) (two independent experiments; n = 8 LIMB-implanted mice, n = 4 control mice). Error bars represent s.d. values. Statistical analysis was performed using t-test (*p < 0.05; **p < 0.01; ***p < 0.001)
Fig. 3
Fig. 3
The bone marrow within the imaging volume reaches steady-state comparable to homeostasis 28 days after LIMB implantation. a Immunofluorescence analysis of bone sections after removal of the LIMB implant over the time course of 4 weeks. ECM formation was identified by the marker Laminin (Lam). Stem-cell antigen 1 (Sca-1) is highly expressed in arterioles. The leukocyte marker CD45 indicates localization of inflammatory cells adjacent to the window cavity (wc). Lam is highly expressed around the implant during the first week and completely normalizes after 2–4 weeks. CD45+ cell accumulations are found during the first weeks in proximity to the wc. b Movat’s pentachrome stain detects connective tissues and reveals remodeling of bone primarily on the periosteal interface near the fixation plate. a, b Images are representative for 3–5 mice per time point post-surgery. c Overview immunofluorescence images of the femoral bones from an individual mouse 3 days post-surgery. Note the specific reaction to the implant-bone marrow interfaces indicated by accumulations of CD45+ cells, and Lam+ and Sca1+ arteries (yellow). bm bone marrow, cb cortical bone. d Immunofluorescence image of the region around the endoscope tubing in a LIMB-implanted femur 7 days post-surgery, including the bone cortex and periosteum under the plate. The presence of various blood vessel subsets indicated by CD31 and Emcn demonstrates intact blood supply to the periosteum and to the bone. Scale bar = 100 µm. e Blood supply is intact throughout the marrow cavity, indicated by CMTPX-labeled splenocytes, which localize in the bone marrow 4 h after transplantation in both contralateral and LIMB-implanted femurs at 42 days post-surgery (n = 3 mice). f Histological DAPI stain (gray) shows intact tissue structure, with no separation of the bone marrow and the vasculature by the screws or endoscope tubing. g Flow cytometry analysis of femurs with the LIMB implant, their contralateral femurs and femurs of control mice. Similar frequencies and cell counts of various cell populations shows no effect of the LIMB implant on bone marrow cell composition (n = 8 LIMB-implanted mice, n = 8 controls, two independent experiments). Error bars represent s.e.m. values. Statistical analysis was performed using t-test
Fig. 4
Fig. 4
Immune cell dynamics in different bone types show comparable motility patterns. a 3D fluorescence images acquired by LIMB in the femoral marrow of a CD19:tdRFP mouse at day 7, day 14, day 28, and day 60 after surgery. Mature B lymphocytes express tdRFP and are displayed in green, whereas the vasculature was labeled with Qdots and is displayed in red. Scale bar = 50 µm. All images are snapshots of 45 min movies, with images acquired every 30 s. The movies are provided as Supplementary Material. b Time-lapse 3D fluorescence image acquired by LIMB in the bone marrow of a CD19:tdRFP mouse at day 90 post-surgery. The tracks of the B lymphocytes smaller than 500 µm3 (defined as B cells with a maximum diameter of 10 µm) are shown in cyan, whereas those with a volume larger than 500 µm3 (defined as plasma cells) are shown in violet. Scale bar = 30 µm. c Similar to b, time lapse 3D image of the bone marrow of a CD19:tdRFP mouse with corresponding tracks of B and plasma cells in the calvarium and d the tibia. Scale bar = 30 µm. Representative movies with cell motility tracks for LIMB, calvarial, and tibial imaging are provided as Supplementary Material. e Quantification of cell volumes, mean velocities, and displacement rates of B lymphocytes from movies acquired by LIMB (n = 4 mice), within the calvarial bone (n = 3 mice), and the tibia (n = 2 mice). Similar cell subset frequencies and mean velocities of B lymphocytes were measured by LIMB in the femoral bone marrow, by calvarial imaging as well as by tibial imaging. We statistically analyzed the data in e using t-test (*p < 0.05; **p < 0.01; ***p < 0.001)
Fig. 5
Fig. 5
Imaging of locally activated paGFP in murine deep femoral marrow reveals high positioning stability of the LIMB implant. a paGFP mice were implanted with a LIMB microendoscope (n = 3 mice). After 35 days, the mice were injected intravenously with Qdots to label the vasculature. Photoactivation of paGFP was performed at a wavelength of 840 nm in a 75 × 75 × 30 µm3 square area in the center of the field of view. Additional injections of Qdots were given before each recording. We performed the described photoactivation experiments repeatedly, up to three times in the same animal at day 27, 35, and 56 post-surgery, during homeostasis with similar results. Blood vessels which could be observed over the whole period of 36 h are indicated by arrowheads, whereas those that appear or disappear within this time period are labeled by asterisks. Scale bar = 30 µm. b Similarly to a, photoactivation of a 150 × 150 × 9 µm3 region within the 500 × 500 × 66 µm3 field of view in a paGFP mouse with a permanent calvarial imaging window let us easily identify the photoactivated area. The paGFP fluorescence could be visualized over several imaging sessions. Scale bar = 100 µm. During these time windows we observed changes of the vasculature in both, the deep femoral marrow and bone marrow islets of the calvarium
Fig. 6
Fig. 6
LIMB approach reveals kinetics of vascular remodeling during bone healing and homeostasis on time scales from hours to months. C57/B6J mice received the LIMB implant and were injected intravenously with Qdots (red) prior to each LIMB imaging session to label the vasculature. Vessels were three-dimensionally imaged at increasing time resolution over the course of a weeks b days and c several hours. In line with our previous observations, we noted prominent changes in the vasculature, which continued over the whole monitoring time period, even after homeostasis is reached (n = 5 mice, two independent experiments, scale bar = 50 µm). Small vessels continuously appear and disappear, larger vessels change their position and shape. The trace of such a larger vessel is displayed at all time points as a line in c. Blood vessels which can be used as landmarks are labeled by arrowheads and those that completely disappear within days are labeled by asterisks. d Overlap of the 3D projections of blood vessels in a mouse 35 days post-surgery (+0 h, green) and 24 h later (+24 h, red). A differential image between the two 3D images was generated. Blood vessel volume change was calculated by dividing the fraction of the volume difference between +24 h and 0 h (cyan areas in the middle panel indicate positive values, i.e., appearance of blood vessels; yellow areas indicate negative values, i.e., disappearance of blood vessels) by the total volume of the blood vessel at +24 h (delineated by white lines in the left panel) to obtain a normalized parameter of vessel volume change. The normalized volume changes (right panel) are dependent on the blood vessel diameter, with small vessels remodeling more rapidly than large vessels (n = 6 mice, scale bar = 100 µm). e Similar to the observations in the deep femoral marrow, repeated imaging of blood vessels in calvarial bone and bone marrow also showed remodeling of the vasculature (n = 3 mice, two independent experiments). Scale bar = 100 µm. Error bars represent s.d. values. Statistical analysis in d was performed using an ANOVA test (*p < 0.05; **p < 0.01; ***p < 0.001)
Fig. 7
Fig. 7
LIMB and immunofluorescence analysis indicate possible mechanisms of vascular morphological changes deep in the femoral bone marrow, during regeneration, and in steady-state homeostasis. a Immunofluorescence analysis shows that type H vessels, characterized by CD31hiEmcnhi-expressing endothelial cells, are induced and present around the implant at day 3 after LIMB implantation. Their presence may vary individually but normalizes within 28 days post-surgery. Sinusoidal and type H vessel morphology adjacent to the wc is irregular in the first week and completely reorganizes to an appearance comparable to vessels found at endosteal areas distant from the injury site (n = 3 mice). bm bone marrow, cb cortical bone. Scale bar = 500 µm (left panels). b Immunofluorescence analysis after EdU pulse-chase experiments indicates similar EdU-uptake in the bone marrow of LIMB-implanted femurs and contralateral bones. Proliferating endothelial cells were rarely present at late time points after implantation. This result also supports the conclusion that 28 days after LIMB implantation both the bone and the bone marrow reach homeostasis (n = 3 mice in each cohort). c 3D fluorescence image (300 × 300 × 66 µm3, left and right panel) acquired by LIMB 26 days post-surgery, in a paGFP mouse with the vasculature labeled by Qdots. Photoactivation was performed within a volume of 100 × 100 × 9 µm3 in the center of the image. The fluorescence image was acquired 2 h post activation. Scale bar = 50 µm. The middle panel shows time-lapse 3D images of the inset from the left panel, indicating that paGFP fluorescent cells outside the initial photoactivation volume are present 3 h after photoactivation and that they fluctuate in number and position within the tissue. Passive displacement of the relatively immobile stromal and vascular compartments by continuous proliferation and movement of hematopoietic cells is a possible mechanism of tissue and vascular re-localization during homeostasis (see Supplementary Movies 10, 11)

References

    1. Ramasamy SK, et al. Regulation of hematopoiesis and osteogenesis by blood vessel-derived signals. Annu. Rev. Cell Dev. Biol. 2016;32:649–675. doi: 10.1146/annurev-cellbio-111315-124936. - DOI - PubMed
    1. Tokoyoda K, Hauser AE, Nakayama T, Radbruch A. Organization of immunological memory by bone marrow stroma. Nat. Rev. Immunol. 2010;10:193–200. doi: 10.1038/nri2727. - DOI - PubMed
    1. Zehentmeier S, et al. Static and dynamic components synergize to form a stable survival niche for bone marrow plasma cells. Eur. J. Immunol. 2014;44:2306–2317. doi: 10.1002/eji.201344313. - DOI - PubMed
    1. Roth K, et al. Tracking plasma cell differentiation and survival. Cytometry A. 2014;85:15–24. doi: 10.1002/cyto.a.22355. - DOI - PubMed
    1. Beck TC, Gomes AC, Cyster JG, Pereira JP. CXCR4 and a cell-extrinsic mechanism control immature B lymphocyte egress from bone marrow. J. Exp. Med. 2014;211:2567–2581. doi: 10.1084/jem.20140457. - DOI - PMC - PubMed

Publication types

LinkOut - more resources