. 2017 Dec 18;7(1):17705.
doi: 10.1038/s41598-017-17672-9.

Novel inhibitors targeting Venezuelan equine encephalitis virus capsid protein identified using In Silico Structure-Based-Drug-Design

Affiliations

Novel inhibitors targeting Venezuelan equine encephalitis virus capsid protein identified using In Silico Structure-Based-Drug-Design

Sharon Shechter et al. Sci Rep. .

Erratum in

Abstract

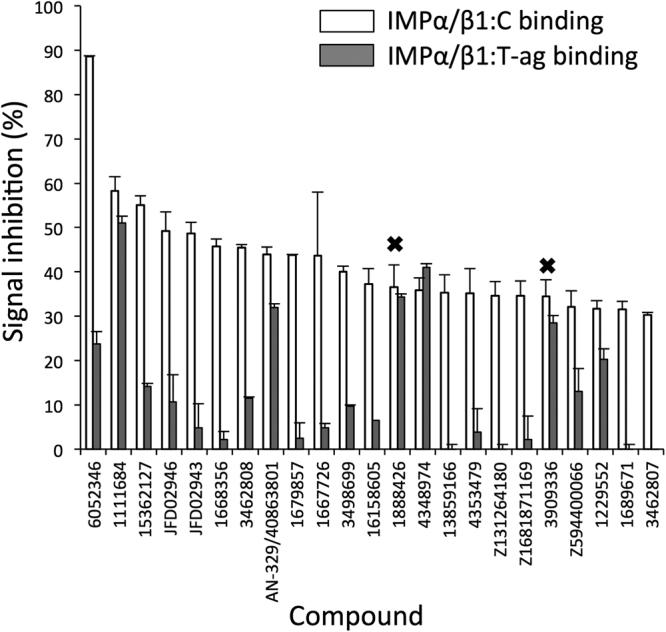
Therapeutics are currently unavailable for Venezuelan equine encephalitis virus (VEEV), which elicits flu-like symptoms and encephalitis in humans, with an estimated 14% of cases resulting in neurological disease. Here we identify anti-VEEV agents using in silico structure-based-drug-design (SBDD) for the first time, characterising inhibitors that block recognition of VEEV capsid protein (C) by the host importin (IMP) α/β1 nuclear transport proteins. From an initial screen of 1.5 million compounds, followed by in silico refinement and screening for biological activity in vitro, we identified 21 hit compounds which inhibited IMPα/β1:C binding with IC50s as low as 5 µM. Four compounds were found to inhibit nuclear import of C in transfected cells, with one able to reduce VEEV replication at µM concentration, concomitant with reduced C nuclear accumulation in infected cells. Further, this compound was inactive against a mutant VEEV that lacks high affinity IMPα/β1:C interaction, supporting the mode of its antiviral action to be through inhibiting C nuclear localization. This successful application of SBDD paves the way for lead optimization for VEEV antivirals, and is an exciting prospect to identify inhibitors for the many other viral pathogens of significance that require IMPα/β1 in their infectious cycle.


Conflict of interest statement

The authors declare that they have no competing interests.

Figures

Figure 1
Figure 1
Definition of the Capsid NLS:IMPα interface. (A) Full, Core and Min-NLS sequences (single letter amino acid code). (B) Docked Core-NLS (brown) aligned on the full NLS (green) from the crystal structure of the VEEV NLS bound to the binding site of IMPα (grey) using Maestro (Schrodinger) and the PDB 3VE6 coordinates. Red and blue represent oxygen and nitrogen atoms respectively. (C) Docked Min-NLS (purple) aligned on the full NLS within the crystal structure of the VEEV NLS bound to the binding site of IMPα as per B.
Figure 2
Figure 2
Delineation of the Min-NLS binding pocket of IMPα. (A) Difference in free energy estimations (ΔG) based on docking experiments for the indicated alanine substitutions of residues within the IMPα binding pocket less than 4 Å from the Min-NLS. For wild type IMPα as well as each alanine substitution, a new docking grid was created and a library of 62 Min-NLS conformations (ConfGen) was used for the docking experiment (Glide, Schrödinger). Based on the docking results, the best-aligned pose for docked Min-NLS consistent with its conformation in the PDB 3VE6 structure was selected to determine the ΔG. ΔG was calculated by using the docking score found with the mutated residue minus the calculated docking score of the wild type. Colour coding relates to “subcompartments” of the NLS binding pocket highlighted in B, where red denotes residues located in the “top” of the pocket, green denotes residues located in the “bottom” of the pocket, W residues appear in black, while blue denotes residues which may hinder compound binding. (B) Representation (Maestro, Schrödinger) of the IMPα binding pocket (grey) with bound Min-NLS residues (yellow), with their respective energy contribution color as seen in A; nitrogen and oxygen atoms are highlighted in blue and red respectively. The red dashed box highlights the “top” of the pocket (residues involved in interaction with the K at position #9 of the Min-NLS), whereas the green dashed box highlights the “bottom” of the pocket (residues involved in interacting with the K residues at positions #6 and 7).
Figure 3
Figure 3
HTS Pipeline to identify inhibitors of C:IMPα binding. Glide (Schrodinger) was used to run a screen for inhibitors of C:IMPα binding from a curated library of 1.5 M compounds that was prepared using Ligprep (Schrodinger); Ligprep produces the low-energy 3D structures with correct chiralities. Consideration of the energy threshold (represented by the docking score), and binding mode and spatial clashes was used to prioirize the hit compounds (to 2672), followed by a scaffold diversity analysis (Schrodinger, Canvas) to enrich the final set. The final set of 84 commercially available compounds was subjected to binding studies examining their ability to inhibit the C:IMPα interaction. Four compounds ultimately progressed to in vivo analysis of their ability to alter C localization/dynamics and inhibition of VEEV replication.
Figure 4
Figure 4
Compounds identified by in silico screening inhibit IMPα/β1:C binding. Pre-dimerized recombinant IMPα/β1 heterodimer (15 nM) and capsid (30 nM) were incubated together in the presence of 10 µM of each compound, and protein binding measured by AlphaScreen assay as described in Materials and Methods. The percentage inhibition of binding effected by each compound above background was standardized to DMSO-only positive control wells. Histogram shows the distribution of activity of all 84 compounds tested.
Figure 5
Figure 5
Compounds identified by in silico screening show specific inhibition of IMPα/β1:C binding. Compounds that inhibited the IMPα/β1:C binding signal by more than 30% were tested for their ability to inhibit IMPα/β1 (15 nM) binding to another IMPα/β1 cargo, SV40 large T-antigen (T-ag 30 nM) via AlphaScreen. Inhibition was adjusted for background and standardised to DMSO-only positive wells as per Materials and Methods. Data represent the mean ± SD (n ≥ 2). Crosses denote compounds with assay inhibition.
Figure 6
Figure 6
Lead compounds inhibit IMPα/β1:C binding with high affinity. 15 nM IMPα/β1 was incubated with 30 nM capsid and increasing concentrations of the individual compounds, using AlphaScreen. Values were adjusted for background and standardised to DMSO-only positive control as per Materials and Methods. Data represent the mean ± SEM (n = 3). Single, representative curves are shown from a series of two similar experiments. ND, not able to be determined due to low levels of inhibition.
Figure 7
Figure 7
Lead compounds inhibit C nuclear import in live cells. HeLa cells transfected to express C-GFPwere treated with 50 µM compound or DMSO for 2 h as indicated, prior to FRAP analysis as per Materials and Methods. The nuclear region (outlined in red) was photo-bleached and fluorescence recovery in this region was measured every 20 s for 580 s. (A) Representative CLSM images of cells pre bleach, immediately following bleaching (0 s), and at the indicated times during recovery. B. Images such as those shown in A were analysed for the recovery of nuclear fluorescence (Fn (rec)). Pooled analysis of curves such as those shown in B were analysed to determine the maximal fractional recovery Fn(rec) max (C) and the initial rate of recovery (Fn(rec) % s−1 (D). Data represent the mean ± SEM (n ≥ 27). *p < 0.05; **p < 0.01; ***p < 0.001.
Figure 8
Figure 8
Lead compounds show specificity for Impα/β1:C. HeLa cells transfected to express C-GFP or T-ag-GFP fusion proteins were treated with 50 µM compound or DMSO as indicated for 20 h prior to CLSM imaging. Image analysis was then used to quantify the extent of nuclear accumulation in terms of the Fn/c ratio (see Materials and Methods). Data represent the mean ± SEM (n ≥ 30). *p < 0.05; **p < 0.01; ***p < 0.001.
Figure 9
Figure 9
Docking of the four lead compounds to IMPα. Top: lead compounds (green) superimposed on the Core-NLS (yellow, conformation from PDB 3VE6). Bottom: IMPα binding pocket (grey) interactions with the compounds. Key residues highlighted are W72, W114 and W161, which participate in hydrophobic interactions (yellow); D122, which participates in salt bridge interactions (blue) and N76, N118 and N158, which participate in hydrogen bonding (red).
Figure 10
Figure 10
Compound 1111684 alters VEEV capsid distribution and inhibits viral replication. (A) Vero cells were treated with serial dilutions of 1111684 in the vehicle DMSO. Luminescence was measured using the Promega CellGlo Viability Assay (see Materials and Methods) at 24 h post-treatment. Data represent the mean ± SD (n = 4) luminescence as a percentage normalized to that of DMSO-treated cells. (B) Vero cells were pretreated with DMSO or increasing concentrations of 1111684 2 h prior to infection, and then infected with VEEV-TC83luc at a multiplicity of infection (MOI) of 1 in the continued presence of 1111684. The BrightGlo Luciferase Assay was performed at 16 h post-infection (p.i.). Data represent the mean ± SD (n = 4) luminescence as a percentage normalized to that of DMSO-treated cells. (C) Vero cells were pretreated with DMSO (0.1%) with or without Mifepristone or 1111684 (10 μM) for 2 h prior to infection with VEEV-TC83 at an MOI of 0.1 in the continued presence of the respective inhibitors. Mock-infected cells were untreated and uninfected. At 16 h p.i., cells were fixed and probed for C (red) and DAPI stained (blue). Nuclear to cytoplasmic fluorescence ratios (Fn/c) were determined as previously, (right). **p < 0.005; ***p < 0.0001.
Figure 11
Figure 11
Antiviral activity of 1111684 is through targeting the IMPα/β1:C interaction. Vero cells were pretreated for 2 h with Mifepristone (10 μM), Ivermectin (1 μM), 1111684 (10 μM), or a DMSO only control. Supernatants were removed, and virus added (WT or CM, MOI 0.1). After 1 h, the medium was replaced with medium containing compound. After 16 h, supernatants were collected and plaque assays performed to determine viral titers (using Vero or BHK.J cells for TC83-WT or TC83-CM virus, respectively). Data represent mean ± SD (n = 3). *p < 0.05 compared to DMSO.

References

    1. Wang HL, O’Rear J, Stollar V. Mutagenesis of the Sindbis virus nsP1 protein: effects on methyltransferase activity and viral infectivity. Virology. 1996;217:527–531. doi: 10.1006/viro.1996.0147. - DOI - PubMed
    1. Strauss JH, Strauss EG. The Alphaviruses: Gene Expression, Replication, and Evolution. Microbiology and Molecular Biology Reviews. 1994;58:491–562. - PMC - PubMed
    1. Frolov, I. Persistent infection and suppression of host response by alphaviruses. Archives of virology. Supplementum, 139–147 (2004). - PubMed
    1. Griffin DE. Emergence and re-emergence of viral diseases of the central nervous system. Prog Neurobiol. 2010;91:95–101. doi: 10.1016/j.pneurobio.2009.12.003. - DOI - PMC - PubMed
    1. Griffin, D. E. In Fields’ Virology Vol. 1 (eds D. M. Knipe & P. M. Howley) Ch. 31, 1023–1069 (Wolters Kluwer Health/Lippincott Williams & Wilkins, 2007).

Publication types

MeSH terms