. 2017 Dec 18;50(1):138-150.
doi: 10.1038/s41588-017-0012-9.

Genomic features of bacterial adaptation to plants

Affiliations

Genomic features of bacterial adaptation to plants

Asaf Levy et al. Nat Genet. .

Abstract

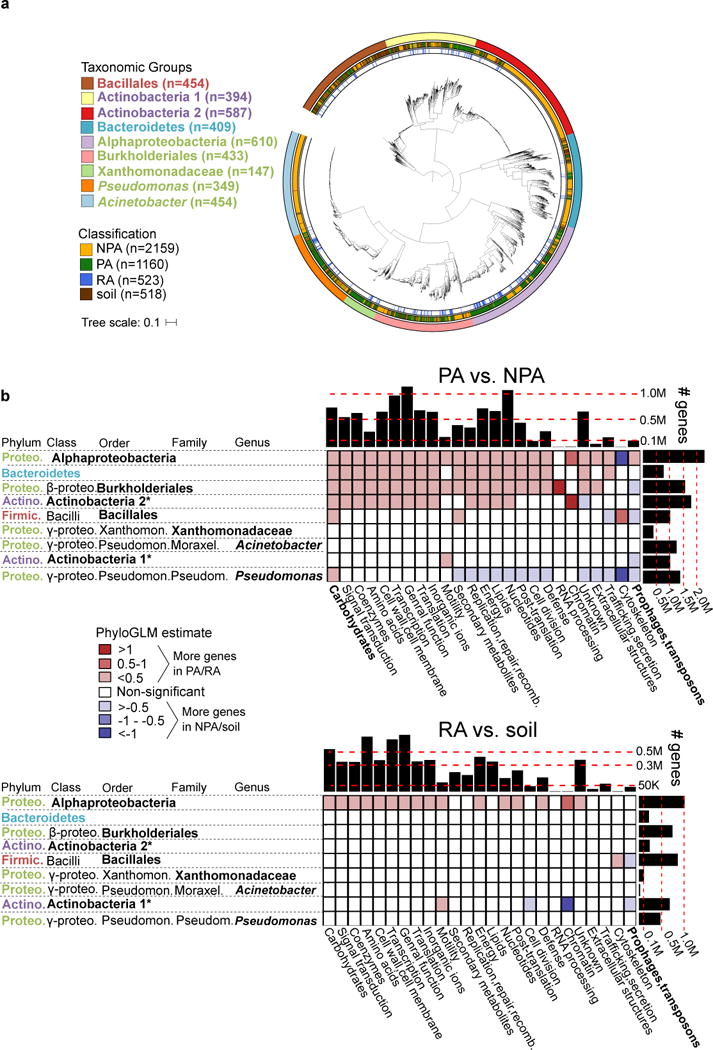
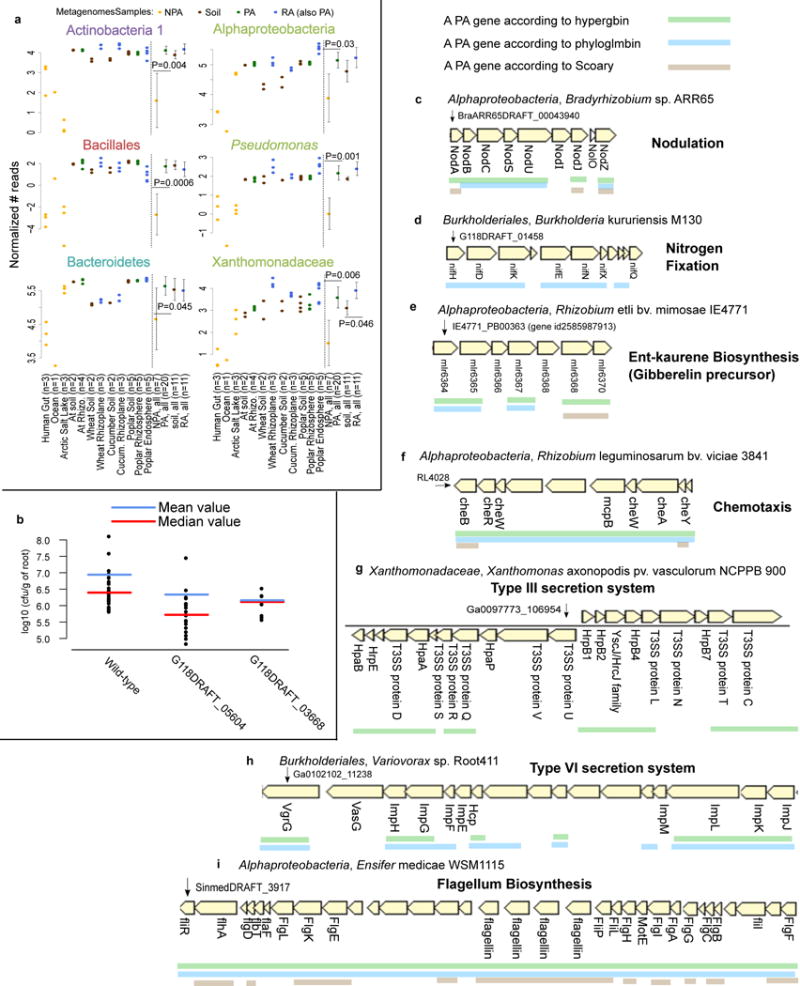
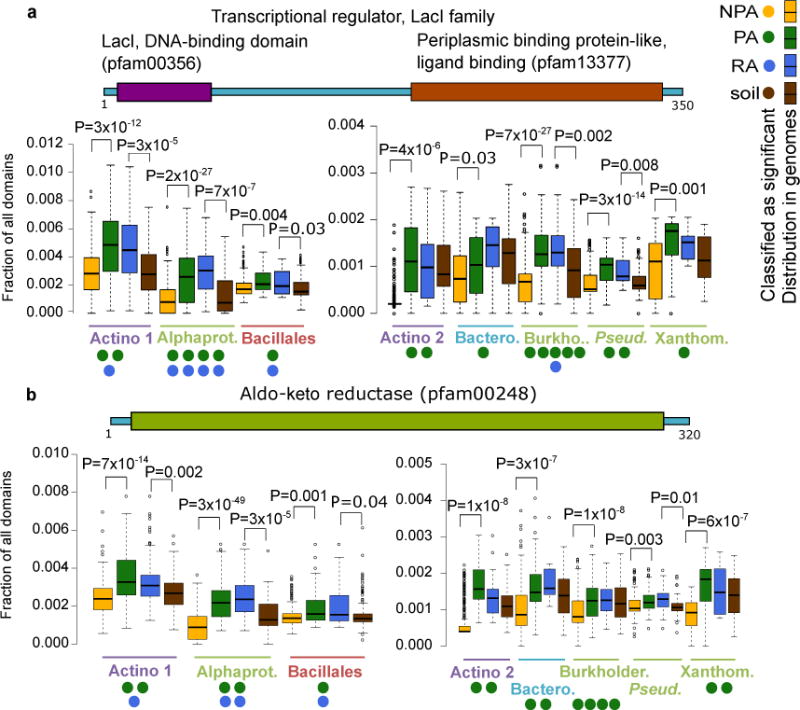
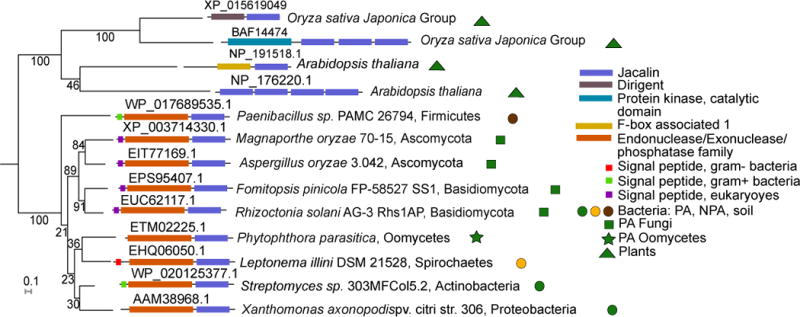
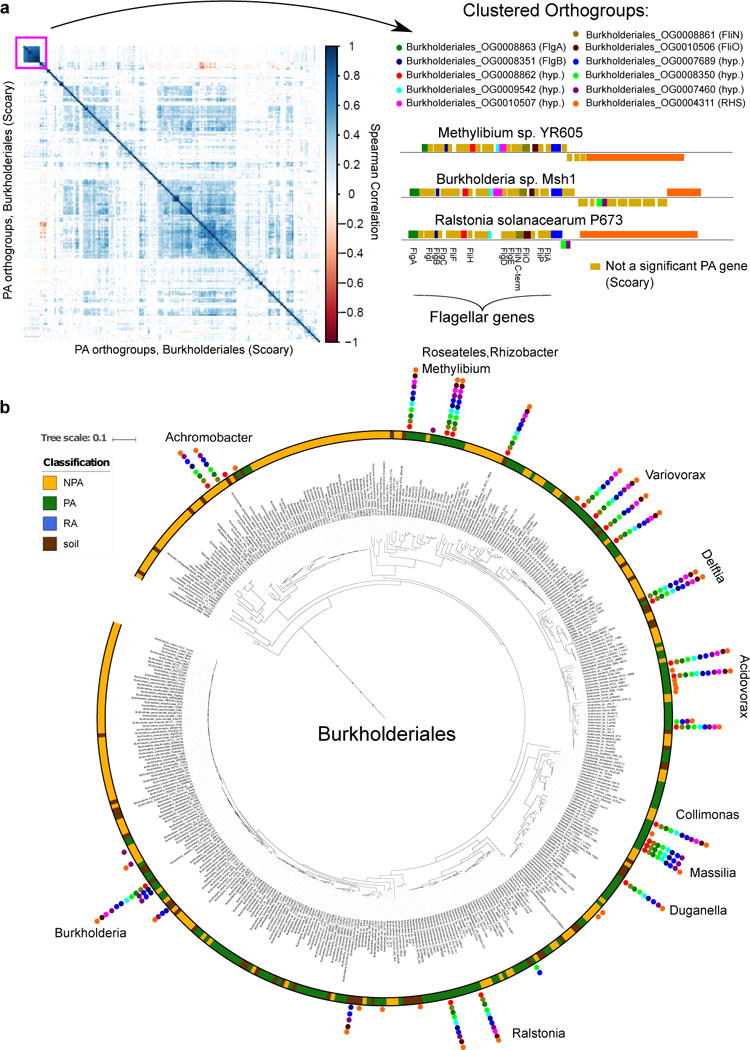
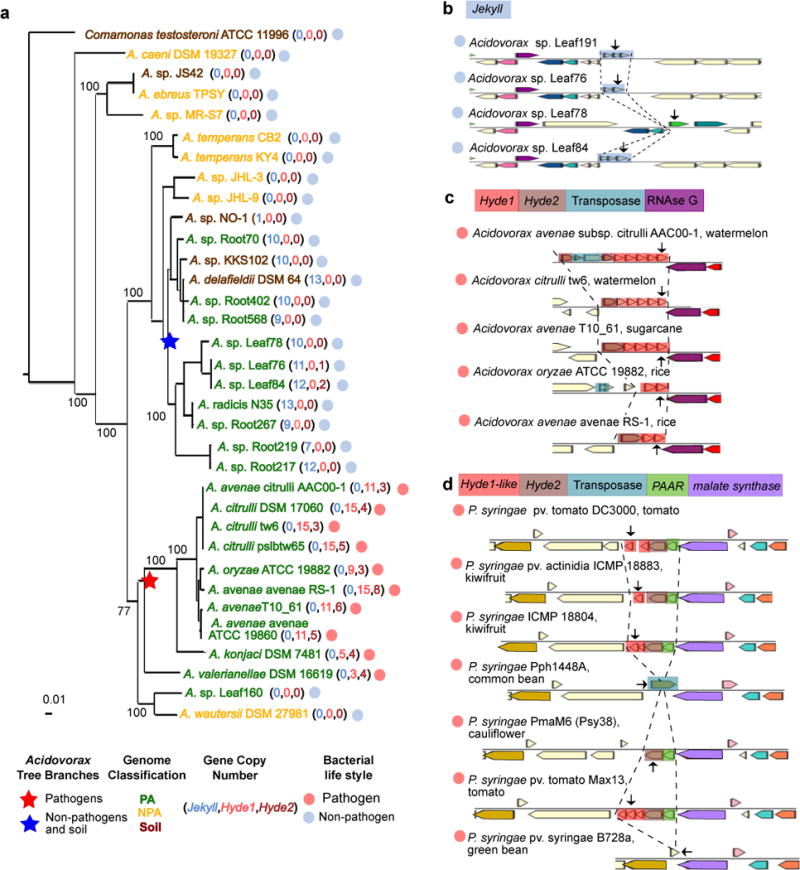
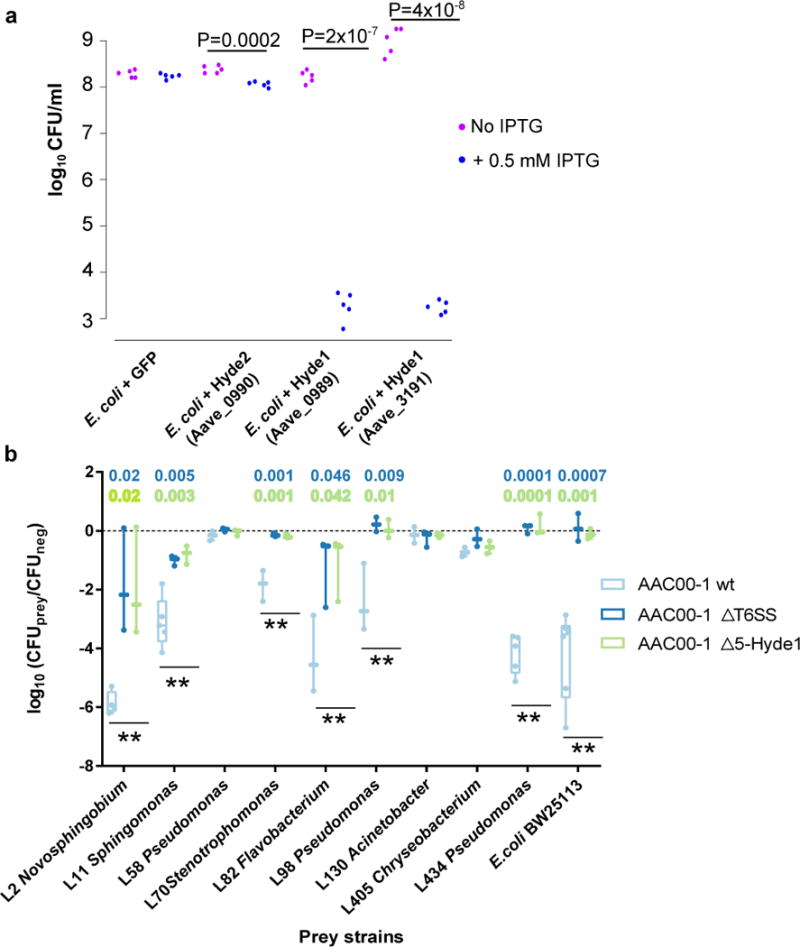
Plants intimately associate with diverse bacteria. Plant-associated bacteria have ostensibly evolved genes that enable them to adapt to plant environments. However, the identities of such genes are mostly unknown, and their functions are poorly characterized. We sequenced 484 genomes of bacterial isolates from roots of Brassicaceae, poplar, and maize. We then compared 3,837 bacterial genomes to identify thousands of plant-associated gene clusters. Genomes of plant-associated bacteria encode more carbohydrate metabolism functions and fewer mobile elements than related non-plant-associated genomes do. We experimentally validated candidates from two sets of plant-associated genes: one involved in plant colonization, and the other serving in microbe-microbe competition between plant-associated bacteria. We also identified 64 plant-associated protein domains that potentially mimic plant domains; some are shared with plant-associated fungi and oomycetes. This work expands the genome-based understanding of plant-microbe interactions and provides potential leads for efficient and sustainable agriculture through microbiome engineering.


Figures

Figure 1
Figure 1. Genome dataset used in analysis and differences in gene category abundances
a. Maximum likelihood phylogenetic tree of 3837 high quality and non-redundant bacterial genomes based on the concatenated alignment of 31 single copy genes. Outer ring denotes the taxonomic group, central ring denotes the isolation source, and inner ring denotes the RA genomes within PA genomes. Taxon names are color-coded based on phylum: green – Proteobacteria, red – Firmicutes, blue – Bacteroidetes, purple - Actinobacteria. See URLs for ITOL interactive phylogenetic tree. b. Differences in gene categories between PA/NPA (top panel) and RA/soil (bottom panel) genomes of the same taxon. For both panels, the heat map indicates the level of enrichment or depletion based on a PhyloGLM test. Significant (colored) cells have p value < 0.05, FDR corrected. Hot colored cells indicate significantly more genes in PA and RA genomes in the upper and lower panels, respectively. Histograms on the upper and right margins represent the total number of genes compared in each column and row, respectively. PA – plant-associated, NPA – non-plant associated, RA – root associated, soil – soil-associated. * not a formal class name. Carbohydrates – Carbohydrate metabolism and transport gene category. Full COG category names from the X axis appear in Supplementary Table 6. Note that cells with high absolute estimate values (dark colors) are based on categories of few genes and are therefore more likely to be less accurate.
Figure 2
Figure 2. Validation of predicted PA genes using multiple approaches
a. PA genes, which were predicted based on isolate genomes, are more abundant in PA metagenomes than in NPA metagenomes. Reads from 38 shotgun metagenome samples were mapped to significant PA, NPA, RA, and soil genes predicted by Scoary. P values are indicated for the significant differences between the PA and NPA or RA and soil in each taxon (two sided t-test). Full results and explanation for normalization are presented in Supplementary Figure 14. b. Rice root colonization experiment using wild type Paraburkholderia kururiensis M130 or knockout mutants for two predicted PA genes. Two mutants exhibited reduced colonization in comparison to wild type: G118DRAFT_05604 (q-value = 0.00013, wilcoxon rank sum test) encodes an outer membrane efflux transporter from the nodT family, and G118DRAFT_03668 (q-value = 0.0952, wilcoxon rank sum test), a Tir chaperone protein (CesT). Each point represents the average count of a minimum of 3-6 plates derived from the same plantlet, expressed as cfu/g of root. c-i. Examples of known functional PA operons captured by different statistical approaches. The PA genes are underlined. c. Nod genes, d. NIF genes, e. ent-kaurene (gibberelin precursor), f. Chemotaxis proteins in bacteria from different taxa. g. Type III secretion system. h. Type VI secretion system, including the imp genes (impaired in nodulation), i. Flagellum biosynthesis in Alphaproteobacteria. Below each gene appears the gene symbol or the protein name where such information was available.
Figure 3
Figure 3. Proteins and protein domains that are reproducibly enriched as PA/RA in multiple taxa
Occurrence of protein domains (from Pfam) was compared between PA and NPA bacteria and between RA and soil bacteria. Taxon names are color coded by phyla as in Figure 1. a. Transcription factors having LacI (Pfam00356) and periplasmic binding protein domains (Pfam13377). These proteins are often annotated as COG1609. b. Aldo-keto reductase domain (Pfam00248). Proteins with this domain are often annotated as COG0667. A two-sided t-test was used for the presence of the genes in a-b between the genomes sharing the same label and was used to verify the enrichment reported by the various tests. FDR-corrected P values are indicated for significant results (q value < 0.05). Filled circles denote the number of different statistical tests (maximum five) supporting a gene/domain being PA/NPA/RA/soil associated. Gene illustrations above each graph represent random protein models. Color coding of the different labels (PA etc.) is as in Figure 1a. Note that a and b have double panels due to different scales. Actino. – Actinobacteria, Alphaprot. – Alphaproteobacteria, Bacil. – Bacillales, Burkholder. – Burkholderiales, Bactero. – Bacteroidetes, Pseud.– Pseudomonas, Xanthom. – Xanthomonadaceae. Box-and-whisker plots represent median, 25th and 75th percentiles, extreme data points that are within a 1.5 fold the interquartile range from the box, and outliers. Full results are in Supplementary Table S19.
Figure 4
Figure 4. A protein family shared by PA bacteria, fungi, and oomycetes that resemble plant proteins
Maximum likelihood phylogenetic tree of representative proteins with Jacalin-like domains across plants and PA organisms. Endonuclease/exonuclease/phosphatase (EEP)-Jacalin proteins are present across PA eukaryotes (fungi and oomycetes) and PA bacteria. In most cases these proteins contain a signal peptide in the N-terminus. The Jacalin-like domain is found in many plant proteins, often in multiple copies. Protein accession appears above each protein illustration.
Figure 5
Figure 5. Co-occurring PA/soil flagellum-like gene cluster is sporadically distributed across Burkholderiales
a. Left panel: A hierarchically clustered correlation matrix of all 202 significant PA orthogroups (gene clusters) from Burkholderiales, predicted by Scoary. Right panel: the orthogroups are presented within and adjacent to the flagellar-like locus of different genomes. Gene names based on blast search appears in parentheses. hyp. - a hypothetical protein, RHS - RHS repeat protein. Genes illustrated above and below line are located on the positive and negative strand, respectively. b. The Burkholderiales phylogenetic tree based on the concatenated alignment of 31 single copy genes. Pillars of filled circles represent the 11 orthogroups presented in a, using the same color coding as in a. Genus names are shown next to each pillar.
Figure 6
Figure 6. Rapidly diversifying, high copy-number Jekyll and Hyde PA genes
a. Maximum likelihood phylogenetic tree of Acidovorax isolates based on concatenation of 35 single-copy genes. The pathogenic and non-pathogenic branches of the tree are perfectly correlated with the presence of Hyde1 and Jekyll genes, respectively. b. An example of a variable Jekyll locus in highly related Acidovorax species isolated from leaves of wild Arabidopsis from Brugg, Switzerland. Arrows denote the following locus tags (from top to bottom): Ga0102403_10161, Ga0102306_101276, Ga0102307_107159, Ga0102310_10161. c. An example of a variable Hyde locus from pathogenic Acidovorax infecting different plants (host plant appears after species name). The transposase in the first operon fragmented a Hyde2 gene. Arrows denote the following locus tags (from top to bottom): Aave_3195, Ga0078621_123525, Ga0098809_1087148, T336DRAFT_00345, AASARDRAFT_03920. d. An example of a variable Hyde locus from pathogenic Pseudomonas syringae infecting different plants. Arrows denote the following locus tags (from top to bottom): PSPTOimg_00004880 (a.k.a PSPTO_0475), A243_06583, NZ4DRAFT_02530, Pphimg_00049570, PmaM6_0066.00000100, PsyrptM_010100007142, Psyr_4701. Genes colored using the same colors in B-D are homologous with the exception of genes colored in ivory (unannotated genes) and Hyde1 and Hyde1-like genes which are analogous by similar size, high diversification rate, position downstream to Hyde2, and a tendency for having a transmembrane domain. PAAR – proline-alanine-alanine-arginine repeat superfamily.
Figure 7
Figure 7. Hyde1 proteins of Acidovorax citrulli AAC00-1 are toxic to E. coli and various PA bacterial strains
a. Toxicity assay of Hyde proteins expressed in E. coli. GFP, Hyde2 - Aave_0990, and two Hyde1 genes from two loci, Aave_0989 and Aave_3191, were cloned into pET28b and transformed into E. coli C41 cells. Aave_0989 and Aave_3191 proteins are 53% identical. Bacterial cultures from five independent colonies were spotted on LB plate. Gene expression of the cloned genes was induced using 0.5 mM IPTG. P values indicate significant results (two sided t-test). b. Quantification of recovered prey cells after co-incubation with Acidovorax aggressor strains. Antibiotic-resistant prey strains E. coli BW25113 and nine different Arabidopsis leaf isolates were mixed at equal ratios with different aggressor strains or with NB medium (negative control). Δ5-Hyde1 contains deletion of five Hyde1 loci (including nine out of 11 Hyde1 genes). ΔT6SS contains a vasD (Aave_1470) deletion. After co-incubation for 19 hours on NB agar plates, mixed populations were resuspended in NB medium and spotted on selective antibiotic-containing NB agar. Box plots of at least three independent experiments with individual values superimposed as dots are shown. Double asterisks denote a significant difference (one-way ANOVA followed by Tukey’s HSD test) between wild type vs. ΔT6SS, and wild type vs. Δ5-Hyde1, with P values denoted on top. Full strain names and statistical information appear in Supplementary Table 25. For a time course experiment with exemplary strains see Supplementary Figure 29.

Comment in

  • Bacterial genomics of plant adaptation.
    Melnyk RA, Haney CH. Melnyk RA, et al. Nat Genet. 2018 Jan;50(1):2-4. doi: 10.1038/s41588-017-0019-2. Nat Genet. 2018. PMID: 29273805 No abstract available.
  • Adapt to plants.
    Lyu J. Lyu J. Nat Plants. 2018 Feb;4(2):60. doi: 10.1038/s41477-018-0110-4. Nat Plants. 2018. PMID: 29379147 No abstract available.

References

    1. Ley RE, et al. Evolution of mammals and their gut microbes. Science. 2008;777:1647–1651. - PMC - PubMed
    1. Baumann P. Biology of bacteriocyte-associated endosymbionts of plant sap-sucking insects. Annu Rev Microbiol. 2005;59:155–189. - PubMed
    1. Sprent JI. 60Ma of legume nodulation. What’s new? What’s changing? J Exp Bot. 2008;59:1081–1084. - PubMed
    1. Pfeilmeier S, Caly DL, Malone JG. Bacterial pathogenesis of plants: future challenges from a microbial perspective. Mol Plant Pathol. 2016;17:1298–1313. - PMC - PubMed
    1. Chowdhury SP, Hartmann A, Gao X, Borriss R. Biocontrol mechanism by root-associated Bacillus amyloliquefaciens FZB42 – a review. Front Microbiol. 2015;6:780. - PMC - PubMed

Publication types