. 2018 Jan;50(1):106-119.
doi: 10.1038/s41588-017-0016-5. Epub 2017 Dec 18.

A molecular roadmap for the emergence of early-embryonic-like cells in culture

Affiliations

A molecular roadmap for the emergence of early-embryonic-like cells in culture

Diego Rodriguez-Terrones et al. Nat Genet. 2018 Jan.

Abstract

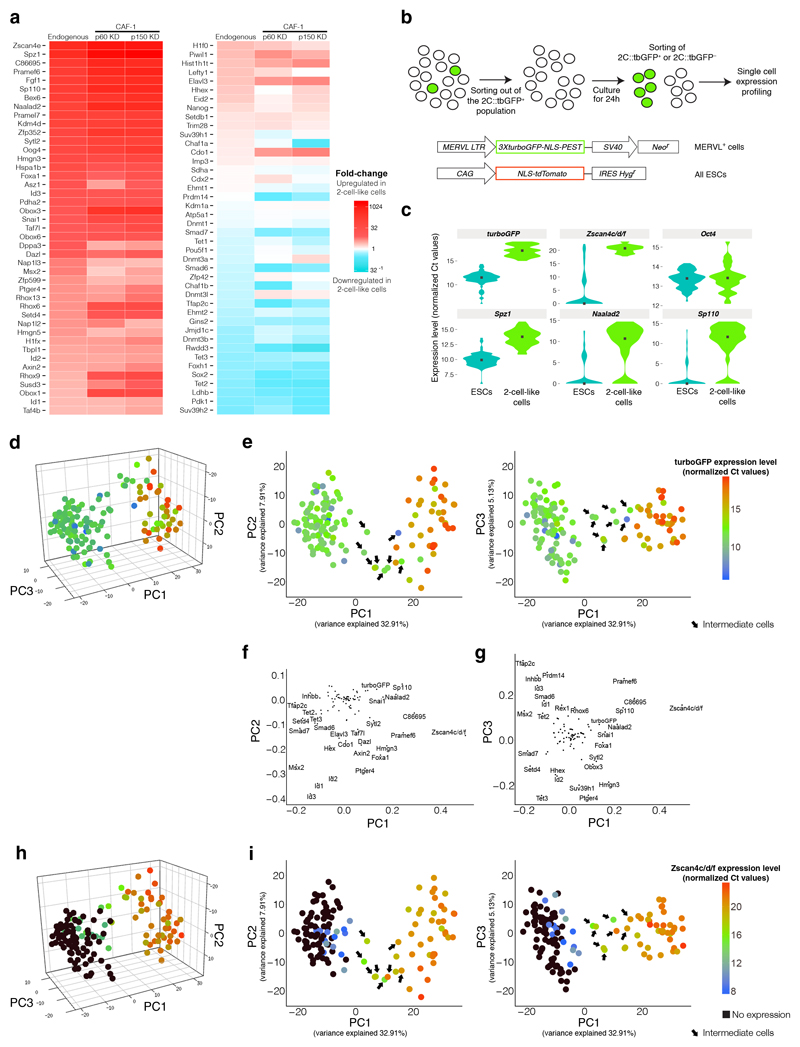
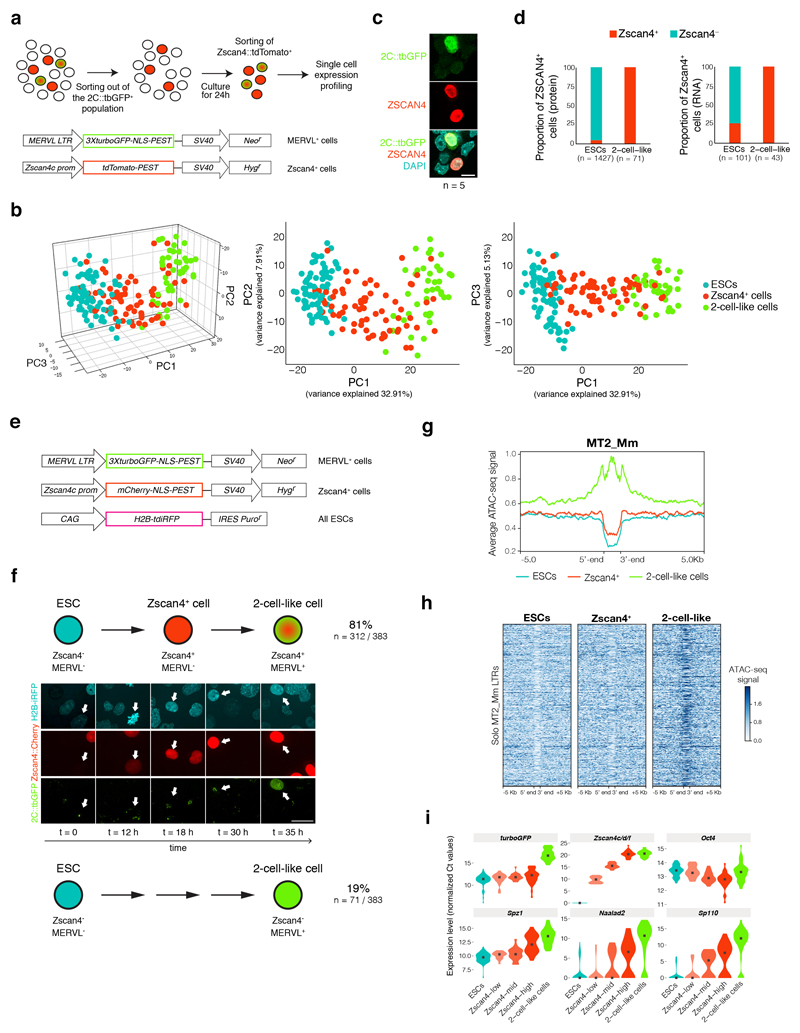
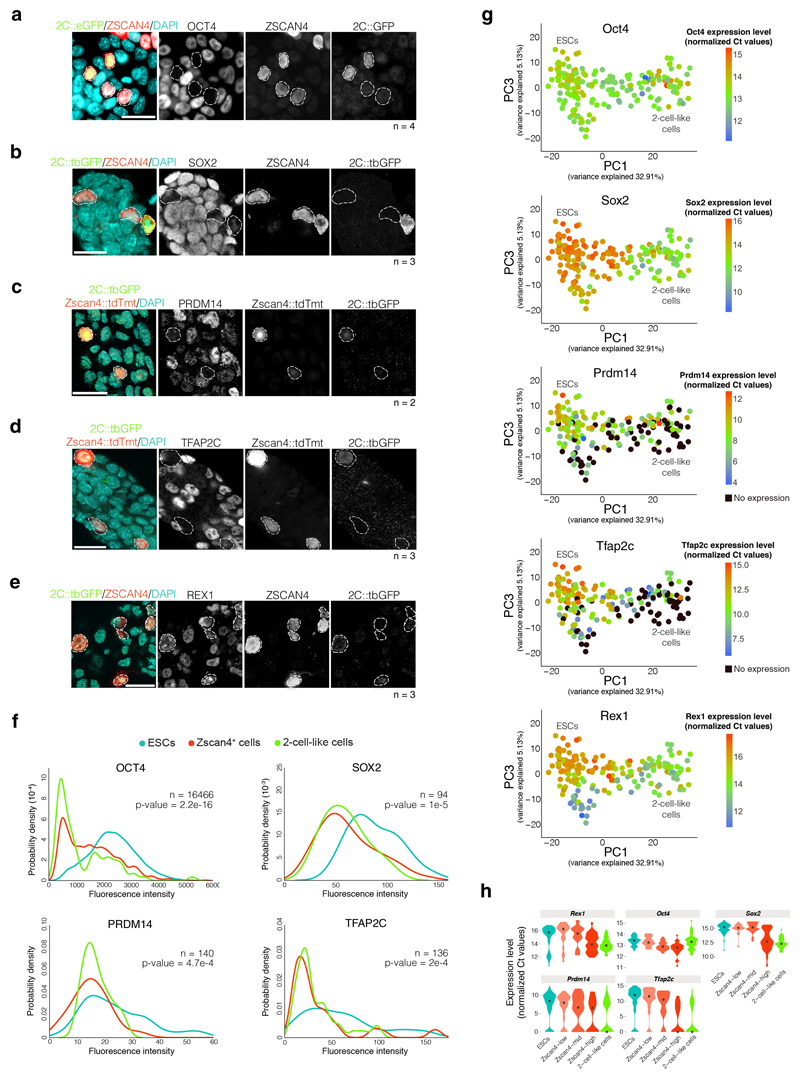
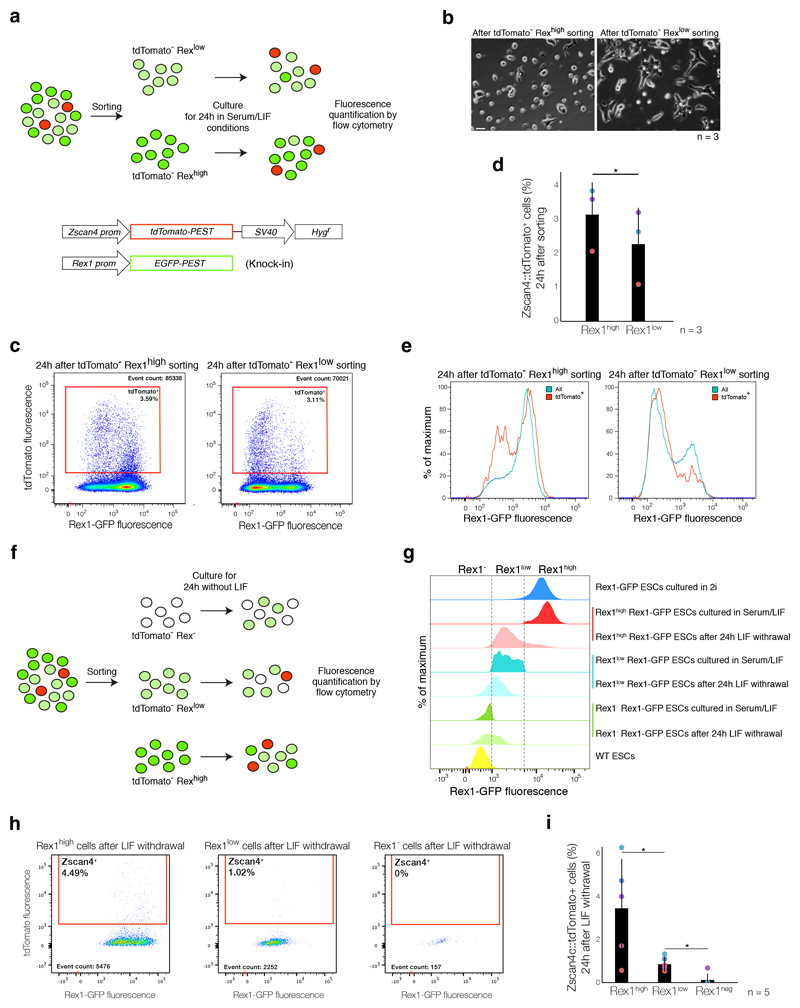
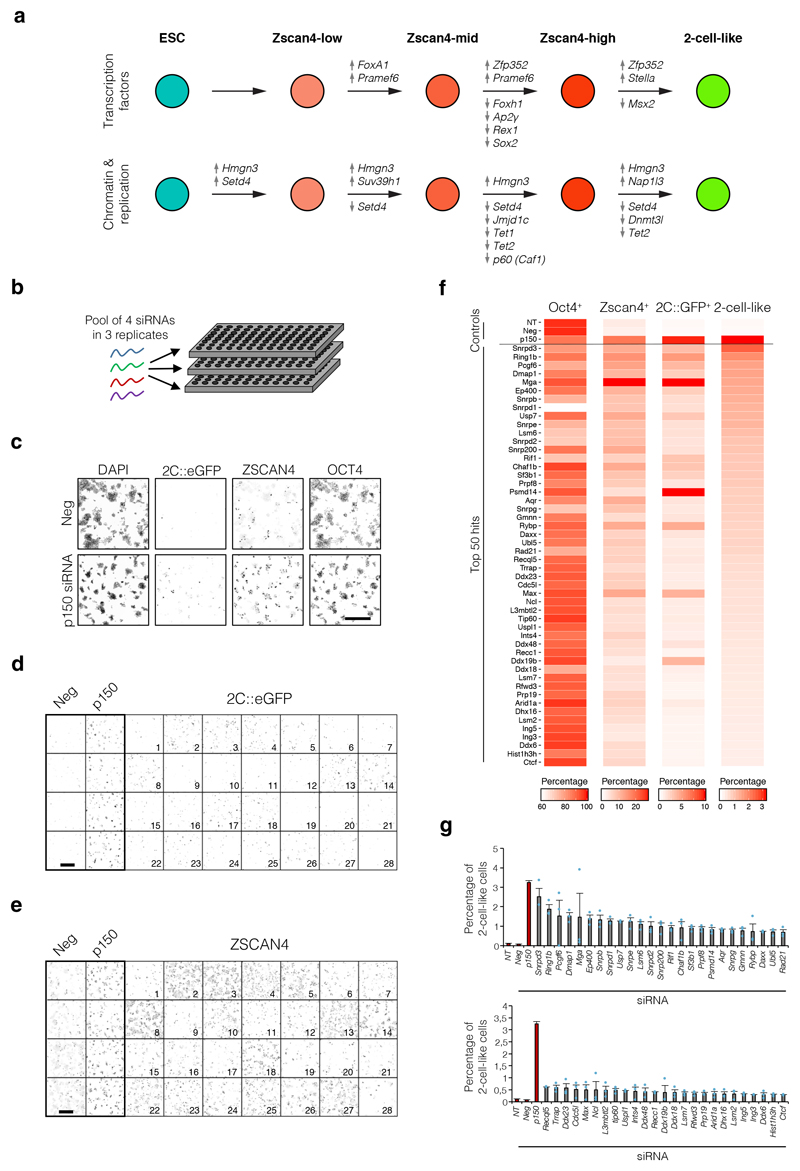
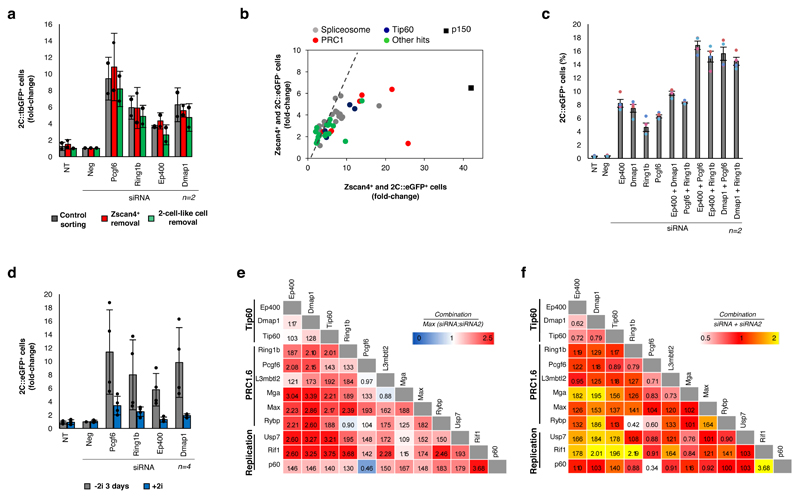
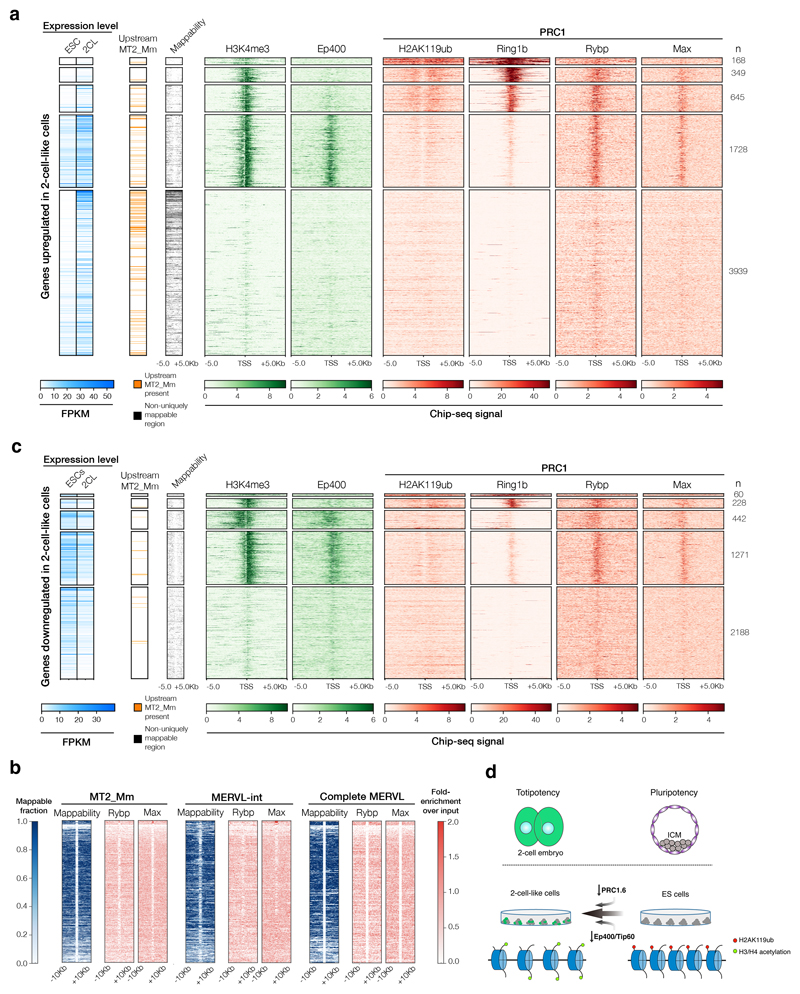
Unlike pluripotent cells, which generate only embryonic tissues, totipotent cells can generate a full organism, including extra-embryonic tissues. A rare population of cells resembling 2-cell-stage embryos arises in pluripotent embryonic stem (ES) cell cultures. These 2-cell-like cells display molecular features of totipotency and broader developmental plasticity. However, their specific nature and the process through which they arise remain outstanding questions. Here we identified intermediate cellular states and molecular determinants during the emergence of 2-cell-like cells. By deploying a quantitative single-cell expression approach, we identified an intermediate population characterized by expression of the transcription factor ZSCAN4 as a precursor of 2-cell-like cells. By using a small interfering RNA (siRNA) screen, we identified epigenetic regulators of 2-cell-like cell emergence, including the non-canonical PRC1 complex PRC1.6 and the EP400-TIP60 complex. Our data shed light on the mechanisms that underlie exit from the ES cell state toward the formation of early-embryonic-like cells in culture and identify key epigenetic pathways that promote this transition.


Conflict of interest statement

The authors declare no competing financial interest.

Figures

Figure 1
Figure 1. Zscan4+ cells exhibit an intermediate expression profile between ESCs and 2-cell-like-cells.
a. Heatmap showing the changes in expression levels of the genes selected for the single cell analysis in endogenous, p60 KD-induced and p150 KD-induced 2-cell-like-cells. Fold-changes are calculated based on bulk RNA-seq data and colour coded relative to ESCs. b. Experimental design. c. Violin plots showing the distribution of the expression levels of individual cells for the indicated genes. Higher values correspond to higher expression levels and a Ct value of 0 indicates that no amplification was detected. Median is indicated by a square. Note that turboGFP and Spz1 possess no exon junctions and therefore their readings reflect to some extent the genomic background. d-e. Different viewpoints of the Principal Component Analysis of the single cell expression dataset. Each point corresponds to a single cell, which is coloured according to the expression level of turboGFP. PC1 separates ES and 2-cell-like-cells. Black arrows indicate turboGFP- cells with an intermediate expression profile between that of ESCs and that of 2-cell-like-cells. f-g. Principal Component projection of the 93 genes used for the analysis, showing the contribution of each gene to the first three principal components. Only the most influential genes are labelled. h-i. PCA as in d-e, but individual cells (dots) are colour-coded according to their levels of Zscan4c/d/f expression. Black dots correspond to no expression.
Figure 2
Figure 2. Two-cell-like cells arise primarily from Zscan4+ cells
a. Experimental design. b. Projection of the individual expression profiles of Zscan4+ cells onto the principal components of the ES and 2-cell-like-cell dataset from Figure 1d-e. Each dot represents a single cell and is coloured according to whether it corresponds to an ES, a Zscan4+ cell or a 2-cell-like-cell as indicated. c. Immunofluorescence of 2C::turboGFP and endogenous ZSCAN4. A representative confocal single section image from 5 different cell culures is shown. Scale bar, 10 μm. d. Quantification of the number of cells expressing ZSCAN4 protein (left), based on immunofluorescence, and mRNA (right), based on the single cell expression analysis, according to whether they are ES or 2-cell-like-cells. n = number of cells. e. Design of the reporter cell line used for the time-lapse shown in Fig. 2f. f. Time-lapse analysis of 2-cell-like and Zscan4+ cells emergence. Spontaneously arising 2-cell-like-cells were classified depending on whether they arose from a Zscan4::mCherry+ cell or not. Results shown are pooled from 11 independent cultures. Scale bar, 20 μm. n = number of cells. g. Average ATAC-seq signal intensity over all annotated MT2_Mm LTRs in ESCs, Zscan4+ and 2-cell-like-cells. h. Heatmaps showing ATAC-seq signal intensity over 10 Kb genomic windows centred on 914 solo MT2_Mm LTRs. i. Violin plots showing the distribution of the expression levels of individual cells for the indicated genes. Higher values correspond to higher expression levels and a Ct value of 0 indicates that no amplification was detected. Median is indicated by a square. Note that turboGFP and Spz1 possess no exon junctions and therefore their readings reflect to some extent the genomic background.
Figure 3
Figure 3. Zscan4+ cells downregulate pluripotency factors
a-e. Immunofluorescence stainings using antibodies for the indicated proteins together with 2C::tbGFP or 2C::eGFP, and Zscan4 or Zscan4::tdTomato, as indicated. The merge image shows the DAPI (cyan), Zscan4 (red) and 2C-reporter (green) expression. Grayscale images of the respective TF, Zscan4 and 2C-reporter channel are shown on the right. Dashed lines contour Zscan4+ and 2-cell-like-cells. Scale bars, 20 μm. n = number of independent cultures. f. Quantification of the data in panels a-e. Density plots of the distribution of mean fluorescence intensities for the indicated TF. The number of cells quantified for each graph is indicated. P-values were calculated using the Mann-Whitney U test. n = number of cells. g. Principal Component analysis of the single cell dataset from Figure 2b, with single cells colour-coded according to their expression level of the indicated transcription factor. Black dots signify no expression. As in Figure 1 and 2, PC1 separates ES from 2-cell-like-cells, while PC3 segregates naive versus primed pluripotency. h. Violin plots showing the distribution of the expression levels of individual cells for the indicated genes. Higher values correspond to higher expression levels and a Ct value of 0 indicates that no amplification was detected. Median is indicated by a square.
Figure 4
Figure 4. Entry into the Zscan4+ state and downregulation of pluripotency factors is unrelated to differentiation
a. Experimental design. Rex1high and Rex1low tdTomato- cells were sorted based on their Rex1::EGFP fluorescence and cultured for 24 hours in serum/LIF over feeders. After this culture period, the number of Zscan4+ cells was determined by FACS. b. Phase-contrast image of Rex1high and Rex1low cells 24h after sorting. Scale bar, 10 μm. n = number of independent cultures. c. Representative scatter plot from data from 4d, showing Zscan4::tdTomato and Rex1-EGFP fluorescence measurements of individual cells as assayed by FACS. d. Quantification of the Zscan4::tdTomato+ population in the Rex1high and the Rex1low fractions as in C. Error bars indicate the s.d. of 3 independent experiments from different cultures. * P < 0.05, paired student’s t-test. e. Density plots of Rex1-EGFP fluorescence for the Rex1high and the Rex1low populations after 24 h of culture under serum/LIF conditions. The entire population is indicated in blue and Zscan4+ cells are indicated in red. Plots are representative from 3 independent cultures. f. Experimental design. Following one week of culture under serum/LIF on feeders, tdTomato+ cells were removed and Rex1high, Rex1low and Rex1- cells were replated without LIF over gelatin for 24 hours, after which the proportion of Zscan4+ cells was determined by FACS. g. Density plots of Rex1-EGFP fluorescence for the Rex1high, Rex1low and Rex1- populations after sorting and 24 hours after LIF withdrawal. Plots are representative from experiments shown in 4i. h. Scatter plots showing Zscan4::tdTomato and Rex1-EGFP fluorescence FACS measurements of individual cells. Plots are representative from experiments shown in 4i. i. Quantification of the data presented in H. Error bars indicate s.d. of 5 independent experiments from different cell cultures. * P < 0.05; paired student’s t-test.
Figure 5
Figure 5. A chromatin modifier siRNA screen identifies regulators of 2-cell-like-cells emergence
a. Schematic representation of significantly and differentially expressed genes between individual stages of the transition from the ES to the 2-cell-like state (Supplementary Table 9). Changes were considered significant if they exhibited at least 2-fold changes across cells between individual states and a P < 0.05 (Mann-Whitney U test). b. Design of siRNA screen. c. Representative inverted dynamics images for the negative (scramble siRNA cells “neg”; n=270 wells) and positive (p150 siRNA transfected cells “p150”; n=270 wells) controls of the screening are shown. Nine random images from one well were combined. Scale bar, 500 µm. d, e. Representative images of the eGFP (d) and ZSCAN4 (e) immunostaining for selected hits from the screening are shown in inverted dynamics. Scale bar represents 500µm. Images correspond to the following siRNA in order, as indicated: 1/Snrpd3 2/Ring1b 3/Pcgf6 4/Dmap1 5/Ep400 6/Snrpb 7/Snrpd1 8/Usp7 9/Snrpe 10/Lsm6 11/Snrpd2 12/Snrp200 13/ Rif1 14/p60 15/Sf3b1 16/Prpf8 17/Psmd14 18/Aqr 19/Snrpg 20/Gmnn 21/Dnmt3b 22/Ubl5 23/Rad21 24/Recql5 25/Trrap 26/Ddx23 27/Cdcl5 28/Ncl. f. Heatmap showing the effect on OCT4, ZSCAN4 and 2C::eGFP expression of the top 50 hits of the screening, ranked according to the percentage of 2-cell-like-cells induced upon siRNA. Data are combined from the primary and the secondary validation screening, and includes additional hits that were tested during the secondary screening. 2-cell-like-cells are defined as cells that are positive for eGFP and ZSCAN4 but negative for OCT4 immunostaining. g. Quantification of 2-cell-like-cells (e.g. 2C::eGFP positive, ZSCAN4 positive and OCT4 negative) induced upon siRNA of the top 50 targets (grey) from the primary and secondary screening. The mean values ± s.d. from triplicate wells are shown. Each dot corresponds to measurements of independent wells. Negative (NT, non-transfected; and Neg, scramble siRNA) and positive (p150) controls are shown in red.
Figure 6
Figure 6. The PRC1.6 and Ep400/Tip60 complexes are inhibitors of 2-cell-like-cells emergence.
a. Protein interaction network for the validated top 49 hits from the screening. b. RT-qPCR analysis of the indicated transcripts after the transfection of the corresponding siRNAs in the 2C::eGFP reporter cell line. Shown are mean values ± s.d. of two technical replicates from 4 independent cultures performed on different days. c-d. Immunostaining of the 2C::eGFP reporter cell line with antibodies to eGFP and ZSCAN4 (c) or eGFP and the GAG coded by the endogenous MERVL loci (d) after transfection of the indicated siRNA. Images are shown in inverted dynamics. Nuclei were counterstained with DAPI (cyan). Scale bar, 200µm. e. RT-qPCR analysis of MERVL and Zscan4 expression in the 2C::eGFP reporter cell line after the transfection of the indicated siRNA. Shown are mean values ± s.d. of two technical replicates from 4 different cell cultures performed on different days. f. Quantification of eGFP-positive cells (%) by FACS after transfection of the indicated siRNA. Mean ± S.D. from independent culture measurements is shown. Each dot indicates measurements from independent cell cultures in panels b, e and f.
Figure 7
Figure 7. PRC1.6 and Ep400/Tip60 regulate 2-cell-like-cells emergence synergistically
a. Induction of 2-cell-like-cells upon siRNA for Pcgf6, Ring1b, Ep400 or Dmpa1 in an initial population of cells devoid of 2-cell-like or of Zscan4-positive cells. In control, ‘sorted’ cells, cells were passed through the FACS sorter, but Zscan4+ and 2-cell like cells were not removed. Quantification of tbGFP-positive cells by FACS was performed 2 days after siRNA transfection. Mean ± s.d. of 2 different transfected wells (dots) is shown. b. Scatter plot of the top 50 hits of the screening showing the fold change of the percentage of ZSCAN4 and 2C::eGFP double positive cells (x-axis) and of cells positive for ZSCAN4 and negative for 2C::eGFP (y-axis). Each dot is colour-coded based on its molecular complex. The dashed grey line indicates a 1:1 ratio. c. Quantification of eGFP-positive cells (%) by FACS after transfection of the indicated single or combined siRNA. Shown are mean values ± s.d. of two independent cell cultures. d. Effect of 2i treatment on 2-cell-like-cell induction upon siRNA for Pcgf6, Ring1b, Ep400 or Dmap1Dmpa1. eGFP-positive cells (%) was quantified by FACS 48h after transfection. Cells were grown in 2i and were either kept in 2i for the whole experiment or 2i was removed 1 day before transfection. Mean ± s.d. of the indicated number of independent cell cultures (shown by individual dots) is shown. e-f. Summary of the combinatorial siRNA analyses on 2-cell-like-cells induction. Pairs of siRNA were co-transfected in the 2C::eGFP reporter cell line and the percentage of 2C::eGFP positive cells was measured by FACS. Combinatorial additive (e) or synergistic effects (f) were assessed.
Figure 8
Figure 8
a, c. Heatmap of the ChIP-seq profiles (for references see Online Methods) of the indicated chromatin modifiers or histone modifications over all TSSs of the (a) 2313 upregulated (6829 TSSs) and the (c) 951 downregulated (4189 TSSs) genes in ESCs grown in serum/LIF conditions. Regions of low mappability are depicted in black, occurrence of an MT2_Mm within the 50kb upstream of the respective TSS is indicated in orange; expression level in ES and 2-cell-like-cells is shown in blue. b. Heatmap of Rybp and Max enrichment (fold-enrichment over input) in 20kb around complete, internal, or solo LTR MERVLs as indicated. The mappability score for the corresponding regions is depicted. d. Working model for 2-cell-like-cells induction from mouse ES cell cultures based on the siRNA screening results. Downregulation of various subunits of the PRC1.6 and Ep400/Tip60 complexes leads to the induction of the 2-cell-like state, which is accompanied by a global reduction of H2AK119ub levels and increased histone acetylation,. The precise interplay of the two complexes as well as the extent to which these mechanisms may operate in vivo to repress the totipotent regulatory program remains to be established.

Similar articles

Cited by

References

    1. Ishiuchi T, Torres-Padilla ME. Towards an understanding of the regulatory mechanisms of totipotency. Current opinion in genetics & development. 2013;23:512–8. - PubMed
    1. Surani MA, Hayashi K, Hajkova P. Genetic and epigenetic regulators of pluripotency. Cell. 2007;128:747–62. - PubMed
    1. Wu G, Scholer HR. Lineage Segregation in the Totipotent Embryo. Current topics in developmental biology. 2016;117:301–17. - PubMed
    1. Nichols J, Smith A. The origin and identity of embryonic stem cells. Development. 2011;138:3–8. - PubMed
    1. Tarkowski AK. Experiments on the development of isolated blastomers of mouse eggs. Nature. 1959;184:1286–7. - PubMed

Publication types

Substances