. 2018 Jan;50(1):73-82.
doi: 10.1038/s41588-017-0015-6. Epub 2017 Dec 18.

Identification of H3K4me1-associated proteins at mammalian enhancers

Affiliations

Identification of H3K4me1-associated proteins at mammalian enhancers

Andrea Local et al. Nat Genet. 2018 Jan.

Abstract

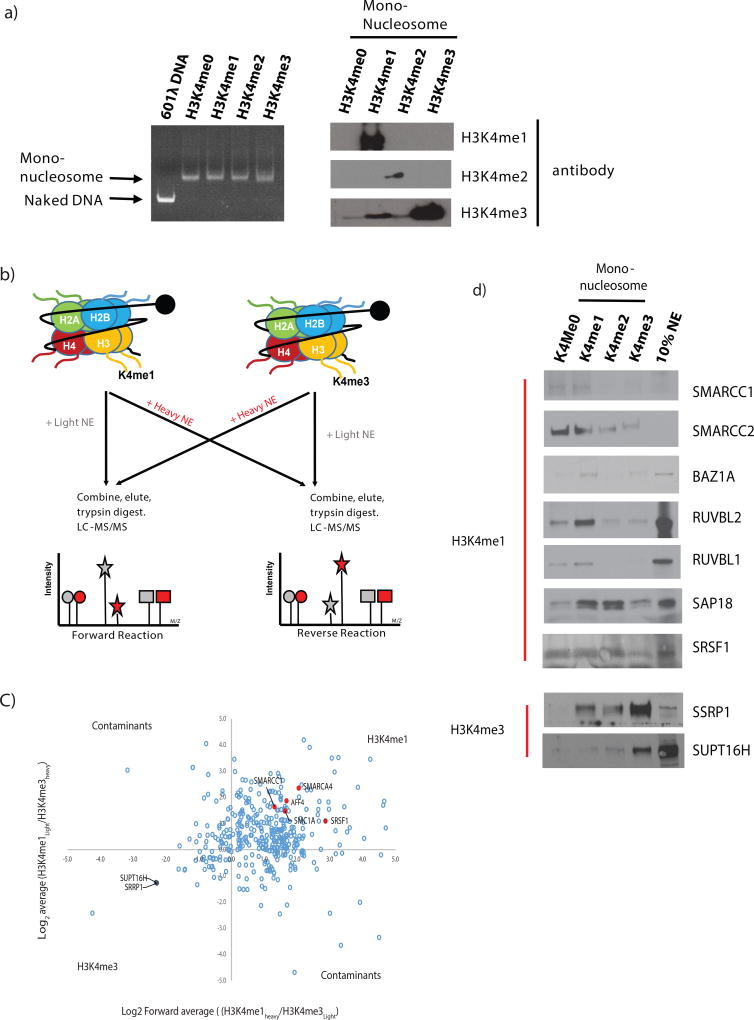
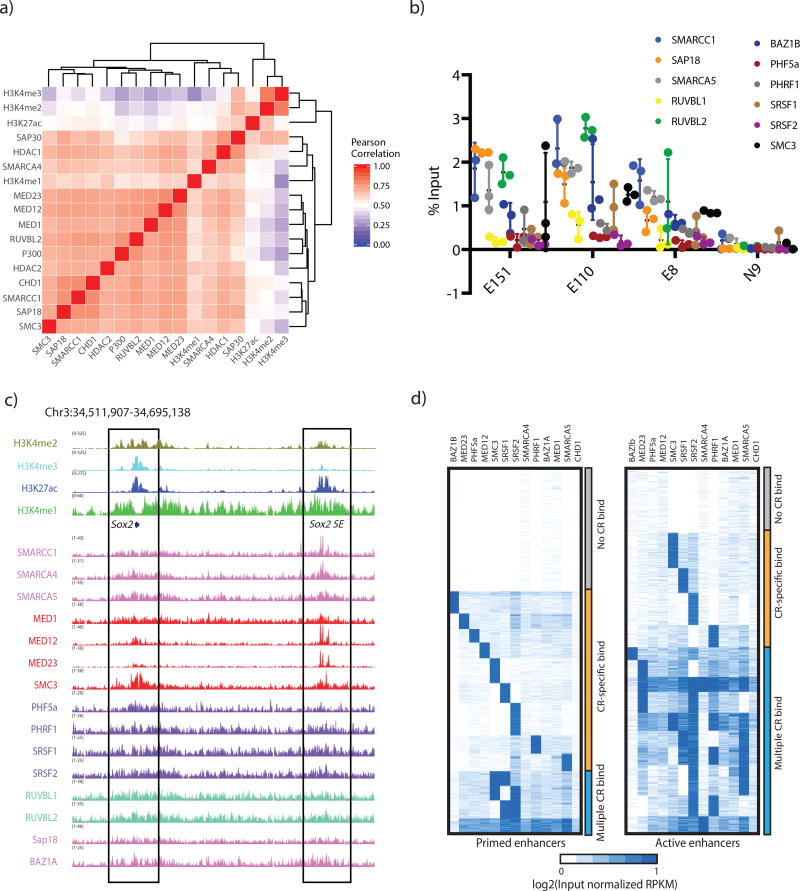
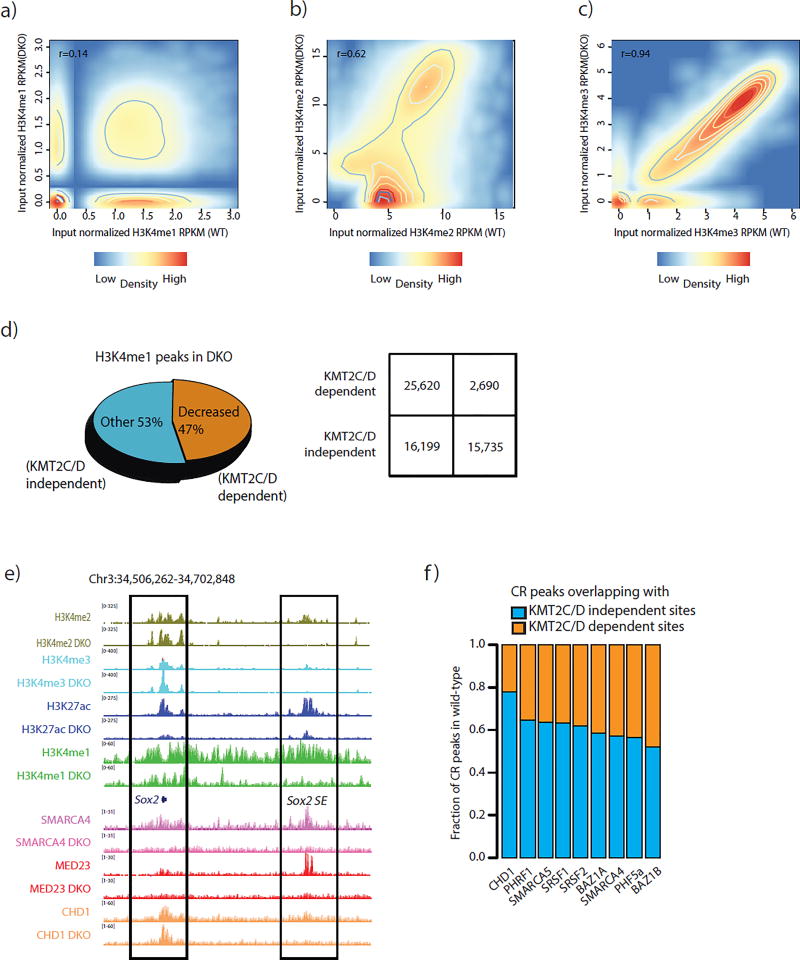
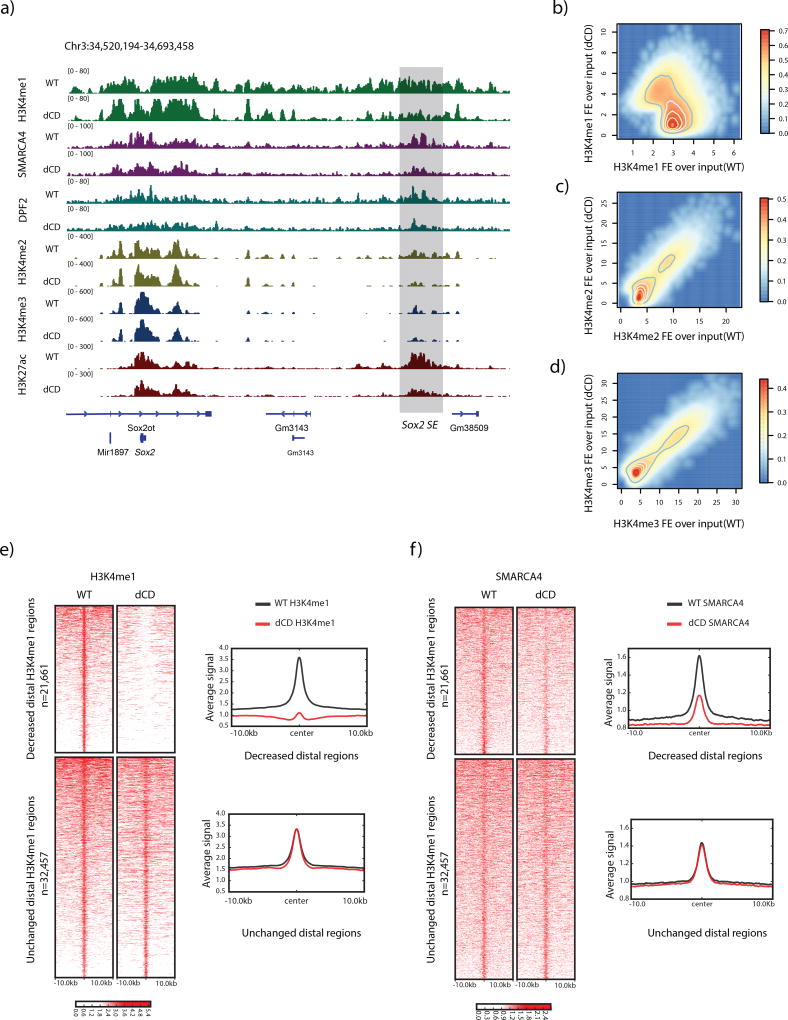
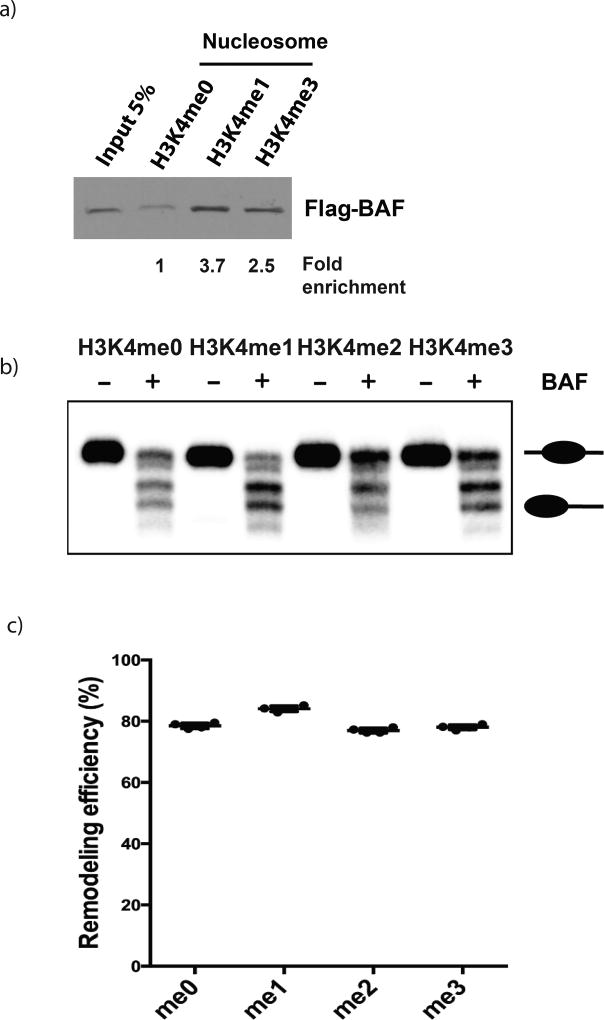
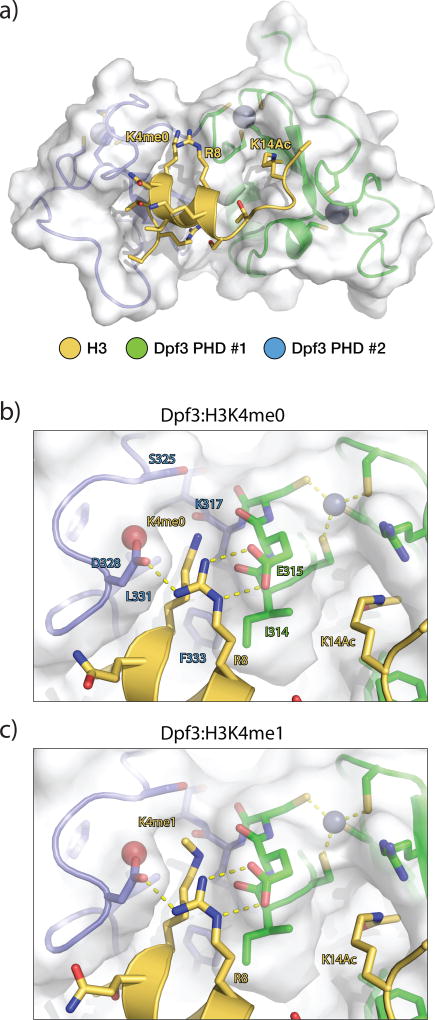
Enhancers act to regulate cell-type-specific gene expression by facilitating the transcription of target genes. In mammalian cells, active or primed enhancers are commonly marked by monomethylation of histone H3 at lysine 4 (H3K4me1) in a cell-type-specific manner. Whether and how this histone modification regulates enhancer-dependent transcription programs in mammals is unclear. In this study, we conducted SILAC mass spectrometry experiments with mononucleosomes and identified multiple H3K4me1-associated proteins, including many involved in chromatin remodeling. We demonstrate that H3K4me1 augments association of the chromatin-remodeling complex BAF to enhancers in vivo and that, in vitro, H3K4me1-marked nucleosomes are more efficiently remodeled by the BAF complex. Crystal structures of the BAF component BAF45C indicate that monomethylation, but not trimethylation, is accommodated by BAF45C's H3K4-binding site. Our results suggest that H3K4me1 has an active role at enhancers by facilitating binding of the BAF complex and possibly other chromatin regulators.


Conflict of interest statement

Competing financial Interests

The authors declare no competing financial interests.

Figures

Figure 1
Figure 1. Identification of H3K4me1 binding proteins using SILAC and Mass-spec analysis
A) Left – Mononucleosomes assembled from biotin tagged 601λ positioning sequence and methylated octamers. Right – Chemically modified nucleosomes are recognized by specific antibodies against various H3K4 methylation. 3 independent chemical modifications were tested yielding similar results. B) Schematic of SILAC mass spec screen. C) Average Log2 L/H of forward reactions on X-axis and log2 H/L of reverse reactions on y-axis (from 4 independent biological replicates). Top right quadrant is H3K4me1 associated factors and bottom left quadrant contains H3K4me3 associated factors. D) Biotin-tagged methylated nucleosomes used as bait for pulldowns from HeLa NE. The bound proteins detected by western blotting with specific antibodies are listed, experiments were repeated at least twice with similar results.
Figure 2
Figure 2. Binding of CRs at H3K4me1 regions and enhancers
A) Hierarchical clustering of genome-wide ChIP-seq signals (RPKM) for H3K4me1, H3K4me2, H3K4me3 and chromatin binding proteins with 1kb-binning, n=2,435,743. The heatmap shows pair-wise Pearson correlation coefficient between different ChIP-seq datasets. B) ChIP-qPCR in mESC with antibodies listed, primers designed for validated enhancers E110, E151, E8 and negative control region N9. Error bars, mean ±SD for n=3 biological replicates. C) Browser shot of candidate H3K4me1 readers at the Sox2 enhancer. Active enhancer with high H3K27ac boxed left, poised enhancer with low H3K27ac boxed right. D) Heat maps for K-means clustering results of input normalized CR signals according to poised enhancers versus active enhancers. Each cluster was manually classified as ‘Multiple CR bind’, ‘CR-specific bind’, and ‘No CR bind’ according to CR binding patterns. Experiments were repeated at least twice with each antibody.
Figure 3
Figure 3. Concomitant loss of H3K4me1 and CR binding at enhancers in KMT2C/D DKO mouse ES cells
A) A scatter density plot of input normalized H3K4me1 RPKMs between wild-type and KMT2C/D DKO cell lines at H3K4me1 peaked regions, n=43,918. B) A scatter density plot of input normalized H3K4me2 RPKMs between WT and KMT2C/D DKO cell lines at H3K4me2 peaked regions, n=33,197. C) A scatter density plot of input normalized H3K4me3 RPKMs between wild-type and KMT2C/D DKO cell lines at H3K4me3 peaked regions, n=22,157. D) Upper panel - A pie chart for the fraction of H3K4me1 peaks in DKO KMT2C/D mESCs according to KMT2C/D dependent or KMT2C/D independent patterns. Lower panel - 2 by 2 table of the relationship with enhancer regions according to KMT2C/D dependent and independent H3K4me1 peaked regions. E) Browser shot of H3K4me1, H3K4me2, H3K4me3, H3K27ac, and CR levels in WT vs DKO KMT2C/D mESCs at the Sox2 enhancer. For each factor top track in form WT and bottom track is DKO. F) Bar plots are shown for the fraction of CR peaks in wild-type (y-axis) according to overlap with KMT2C/D independent (blue) and dependent sites (orange). Total number of CR peaks identified are : CHD1 (n=14,846), PHRF1 (n=21,924), SMARCA5 (n=13,891), SRSF1 (n=23,221), SRSF2 (n=31,200), BAZ1A (n=13,806), SMARCA4 n=10,897), PHRF5a (n=11,926), BAZ1B (n=5,405). Experiments were repeated at least twice in each cell type.
Figure 4
Figure 4. Reduced BAF complex binding is associated with depletion of H3K4me1 in KMT2C/D catalytically null (dCD) cells
A) Browser shot of ChIP-seq signal (RPKM) for SMARCA4 and DPF2 at the Sox2 locus. The Sox2 super-enhancer is shaded on right. Experiments were repeated independently twice with similar results. B,C,D) Scatter density plots of input normalized fold enrichment between WT and dCD at H3K4me1(n=82,053), H3K4me2(n=53,501) and H3K4me3(n=34,553) peaked regions. E) Left - Heatmap of input normalized H3K4me1 ChIP signal in WT and dCD over 21,661 distal H3K4me1 regions with decreased signals in dCD and 32,475 distal H3K4me1 regions with invariable signals, with regions sorted by strength of H3K4me1 signal. Right - aggregate plot showing the average signal in WT and dCD. F) Left - Heatmap of input normalized SMARCA4 ChIP-seq signal in WT and DCD over the same regions in E. Right - aggregate plot showing the average signal in WT and dCD.
Figure 5
Figure 5. BAF complex preferentially binds and remodels H3K4me1 modified nucleosomes
A) Purified Flag-BAF complex binding to H3K4 methylated-nucleosomes, western blotted with anti-FLAG antibody (M2). Pulldown repeated 3 times yielding the same result. B) Polyacrylamide gel showing representative (n=4) in vitro remodeling assay. After incubation with BAF complex, nucleosomes are slid to the end of the 216-bp DNA fragment resulting in a change in mobility in the gel. Top band is un-remodeled nucleosome, and lower four bands are slid nucleosomes with different positions away from 146-bp Widom601 binding sites in the middle. C) Quantification of nucleosome remodeling assays. Error bars, mean ±SD n=4 biological replicates, see Figure S4C. The reduced percentage of the top band is defined as remodeling efficiency.
Figure 6
Figure 6. Structural basis for H3K4 recognition by DPF3
A) Overall structure of DPF3:H3K4me0 complex. DPF3 PHD1 domain is shown in green, PHD2 in blue, and histone H3 tail peptide shown in yellow. B) Close-up view of the DPF3 PHD1–2 region (light blue, white surface) with H3 residues 1–18 with H3K4me0 and H3K14ac (yellow). PHD1 binds H3K14ac as previously observed, while PHD2 binds H3K4 and H3R8. C) Close-up view of DPF3 binding H3 1–18 with H3K4me1 and H4K14ac. The mono-methyl group is accommodated in a pre-formed surface pocket on DPF3. For views of the overall structure and electron density maps, see Figure S5.

Comment in

References

    1. Hardison RC, Taylor J. Genomic approaches towards finding cis-regulatory modules in animals. Nat Rev Genet. 2012;13:469–83. - PMC - PubMed
    1. Heintzman ND, et al. Distinct and predictive chromatin signatures of transcriptional promoters and enhancers in the human genome. Nat Genet. 2007;39:311–8. - PubMed
    1. Creyghton MP, et al. Histone H3K27ac separates active from poised enhancers and predicts developmental state. Proc Natl Acad Sci U S A. 2010;107:21931–6. - PMC - PubMed
    1. Heintzman ND, et al. Histone modifications at human enhancers reflect global cell-type-specific gene expression. Nature. 2009;459:108–12. - PMC - PubMed
    1. Heinz S, Romanoski CE, Benner C, Glass CK. The selection and function of cell type-specific enhancers. Nat Rev Mol Cell Biol. 2015;16:144–54. - PMC - PubMed

Publication types