. 2017 Dec 18;8(1):2154.
doi: 10.1038/s41467-017-01958-7.

Evidence for causal top-down frontal contributions to predictive processes in speech perception

Affiliations

Evidence for causal top-down frontal contributions to predictive processes in speech perception

Thomas E Cope et al. Nat Commun. .

Abstract

Perception relies on the integration of sensory information and prior expectations. Here we show that selective neurodegeneration of human frontal speech regions results in delayed reconciliation of predictions in temporal cortex. These temporal regions were not atrophic, displayed normal evoked magnetic and electrical power, and preserved neural sensitivity to manipulations of sensory detail. Frontal neurodegeneration does not prevent the perceptual effects of contextual information; instead, prior expectations are applied inflexibly. The precision of predictions correlates with beta power, in line with theoretical models of the neural instantiation of predictive coding. Fronto-temporal interactions are enhanced while participants reconcile prior predictions with degraded sensory signals. Excessively precise predictions can explain several challenging phenomena in frontal aphasias, including agrammatism and subjective difficulties with speech perception. This work demonstrates that higher-level frontal mechanisms for cognitive and behavioural flexibility make a causal functional contribution to the hierarchical generative models underlying speech perception.


Conflict of interest statement

The authors declare no competing financial interests

Figures

Fig. 1
Fig. 1
An illustration of the experimental motivation. a A schematic Bayesian framework for predictive coding in speech perception. b The putative brain basis of this framework. Predictions are generated in inferior frontal gyrus and/or frontal motor speech regions (pink), and instantiated in auditory regions of superior temporal lobe (pale blue). c The two dimensional experimental manipulation employed here to detect a dissociation between normal temporal lobe responses to sensory detail (number of vocoder channels) and abnormal frontal lobe responses to prior congruency. d Our experiment relies on detecting the consequences of degraded predictions in abnormal frontal brain regions by measuring their effects in normal temporal regions. e Voxel-based morphometry in our patient group. Regions coloured in red displayed consistent reductions in grey matter volume (FWE p < 0.05). Regions coloured blue had strong evidence for normal cortical volume in nfvPPA (Bayesian probability of the null >0.7, cluster volume>1 cm3). Uncoloured (grey) areas had no strong evidence for or against atrophy
Fig. 2
Fig. 2
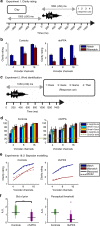
Behaviour. a Experiment 1 design. A Match trial is shown. In a Mismatch trial, the written and vocoded words would share no phonology (for example the written cue ‘clay’ might be paired with the vocoded word ‘sing’). b Group-averaged clarity ratings for each condition. Error bars represent standard error across individuals within each group. c Four alternative forced choice vocoded word identification task. d Group-averaged per cent correct report for each condition. Chance performance at 25%. Error bars represent standard error across individuals within each group. e Overall group fits for single subject Bayesian data modelling of the data from b. f Derived parameters from the Bayesian data modelling. A.U., arbitrary units. Patients with nfvPPA displayed significantly more precise prior expectations than controls (Wilcoxon U(11,11) p < 0.01). They also displayed a trend towards a reduction in perceptual thresholds (Wilcoxon U(11,11) p = 0.075)
Fig. 3
Fig. 3
The effect of vocoder channel number. Illustrative topographic plots are shown of the main effect of vocoder channels across all participants. No group by sensory detail interactions were observed either at the peak locations (marked by white stars) or in a confirmatory SPM analysis
Fig. 4
Fig. 4
The effect of prime congruency. a Illustrative scalp topographic plots of the main effect of cue congruency for each group from 400 ms to 700 ms, a period of where both groups showed a large statistical effect of congruency with similar topography. White stars indicate the scalp location of the peak congruency effect across both groups between −100 ms and 900 ms (FWE p < 0.001 for all sensor types). b Significant group by congruency interactions (p < 0.05 sustained for more than 25 ms at the scalp locations marked by white stars in the upper panel) were observed in planar gradiometers and magnetometers, and are shaded in lilac. c Topographic plots for each group are shown averaged across each significant cluster of group by congruency interaction
Fig. 5
Fig. 5
Evoked source space analysis. a Evoked source reconstructions (sLORETA) for the main effect of clarity for all participants combined. b Source reconstructions for the main effect of congruency for each group individually. c Illustrative bar charts are plotted at the bottom for source power by group and condition in the frontal (IFG) and temporal (STG) regions of interest for each time window. A.U., arbitrary units. Statistically significant differences are marked by asterisks (detail in ‘Results’ section of text). Error bars represent the between-subject standard error of the mean (not the between condition standard error, which is much lower due to the repeated measures design). d Overall power in each source by group and condition across the whole time window of interest
Fig. 6
Fig. 6
Analysis of induced responses after the written but before spoken word. Total induced power after written word onset by group, the overall t-score for difference from baseline for both groups combined, and the relationship between single subject response at the late beta peak (indicated by a white star) and precision of their prior expectations in the Bayesian behavioural model. A.U., arbitrary units. The grey shaded area in the bottom right plot indicates the 95% confidence band for the regression line, marked in black
Fig. 7
Fig. 7
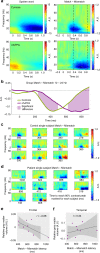
Analysis of induced responses after the spoken word. a Total induced power after spoken word onset and main effect of cue congruency by group. b Overall induced power difference between Match and Mismatch conditions in the alpha/beta overlap range. c Single subject time–frequency profiles for each control. The time taken to reach 80% of the peak power contrast between Match and Mismatch trials is indicated for each individual by the number below the corresponding abscissa. d Single subject time–frequency profiles for each patient. e Significant negative correlation between frontal grey matter volume (adjusted for age and total-intracranial volume at the co-ordinates in Fig. 5c) and the time taken to express a congruency contrast (d). The grey shaded area indicates the 95% confidence band for the regression line, marked in black. f No significant correlation between similarly adjusted superior temporal grey matter volume and effect latency
Fig. 8
Fig. 8
Coherence and connectivity analysis. For the time series of frontal and temporal sources of interest between 0 and 900 ms after every spoken word onset. The evoked waveform was subtracted from the time series of frontal and temporal source activity between 0 and 900 ms after every spoken word onset before analysis. Horizontal lines at the top of each plot denote frequencies at which the line of matching colour statistically exceeds either the null distribution a and c, its counterpart condition (b) or differs from zero (d). A: Imaginary coherence. The median of the observed inter-source coherence is shown in black. 1000 randomisations of the null distribution are shown in grey. b Imaginary coherence by group. Shading represents standard error of the mean. c Granger causality. Median influences from temporal to frontal sources are shown in green and frontal to temporal sources in blue. 1000 randomisations of the null distribution are shown in grey. d Relative normalised Granger causal relationships between temporal and frontal sources by frequency. Grey shading represents the standard error of the directionality contrast in a repeated measures general linear model

Similar articles

Cited by

References

    1. von Helmholtz, H. Helmholtz’s Treatise on Physiological Optics, Wisconsin, Vol. 3 (Optical Society of America, 1925).
    1. Hinton GE. Learning multiple layers of representation. Trends Cogn. Sci. 2007;11:428–434. doi: 10.1016/j.tics.2007.09.004. - DOI - PubMed
    1. Friston K. Hierarchical models in the brain. PLoS Comput. Biol. 2008;4:e1000211. doi: 10.1371/journal.pcbi.1000211. - DOI - PMC - PubMed
    1. Rao RP, Ballard DH. Predictive coding in the visual cortex: a functional interpretation of some extra-classical receptive-field effects. Nat. Neurosci. 1999;2:79–87. doi: 10.1038/4580. - DOI - PubMed
    1. Friston K. A theory of cortical responses. Philos. Trans. R. Soc. B: Biol. Sci. 2005;360:815–836. doi: 10.1098/rstb.2005.1622. - DOI - PMC - PubMed

Publication types

LinkOut - more resources