. 2017 Dec 18;8(1):2152.
doi: 10.1038/s41467-017-01200-4.

PAX7 target genes are globally repressed in facioscapulohumeral muscular dystrophy skeletal muscle

Affiliations

PAX7 target genes are globally repressed in facioscapulohumeral muscular dystrophy skeletal muscle

Christopher R S Banerji et al. Nat Commun. .

Abstract

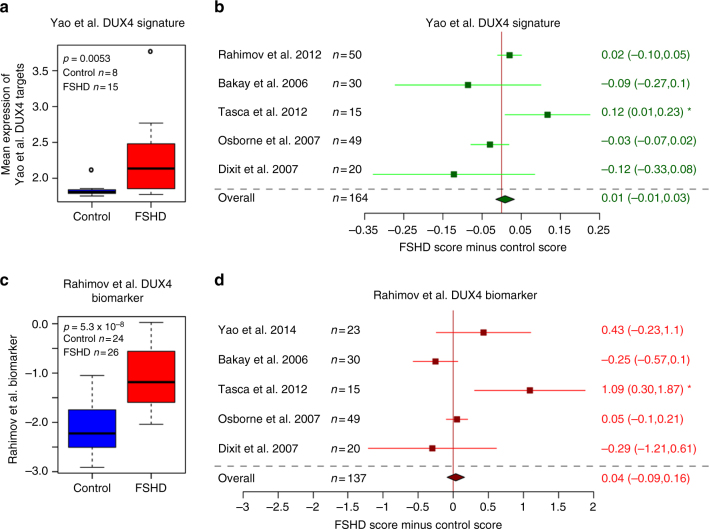
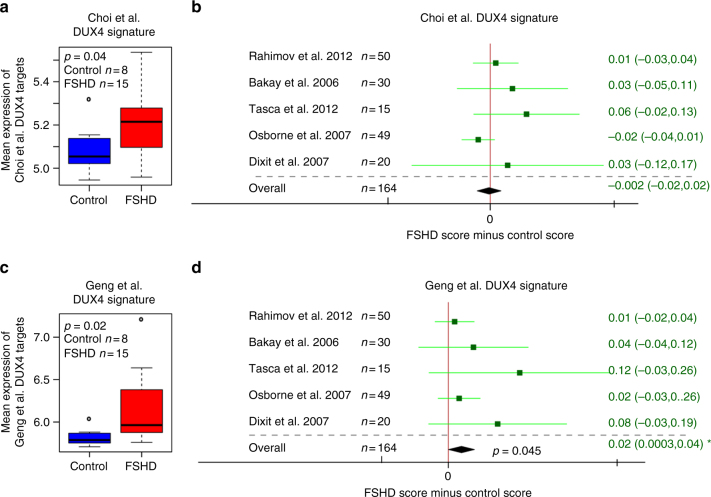
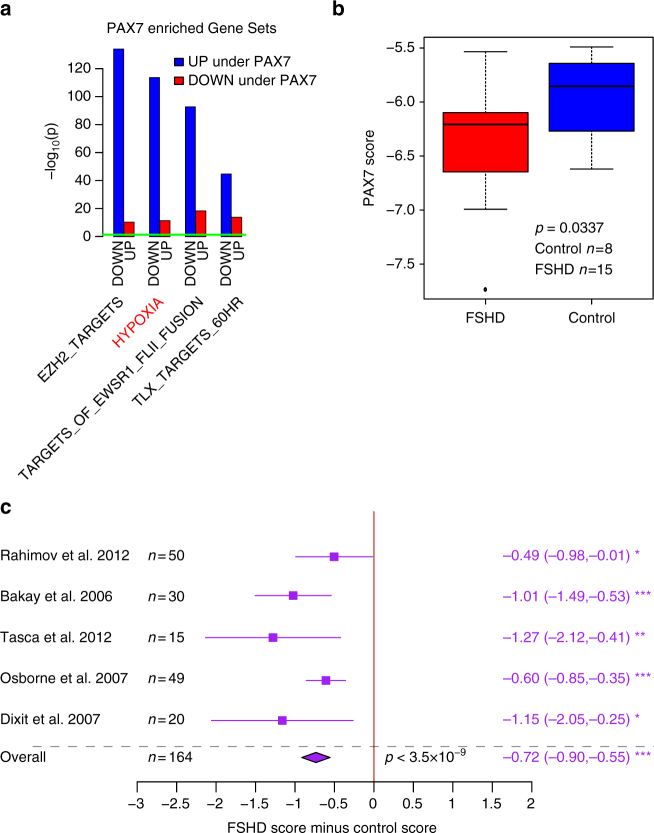
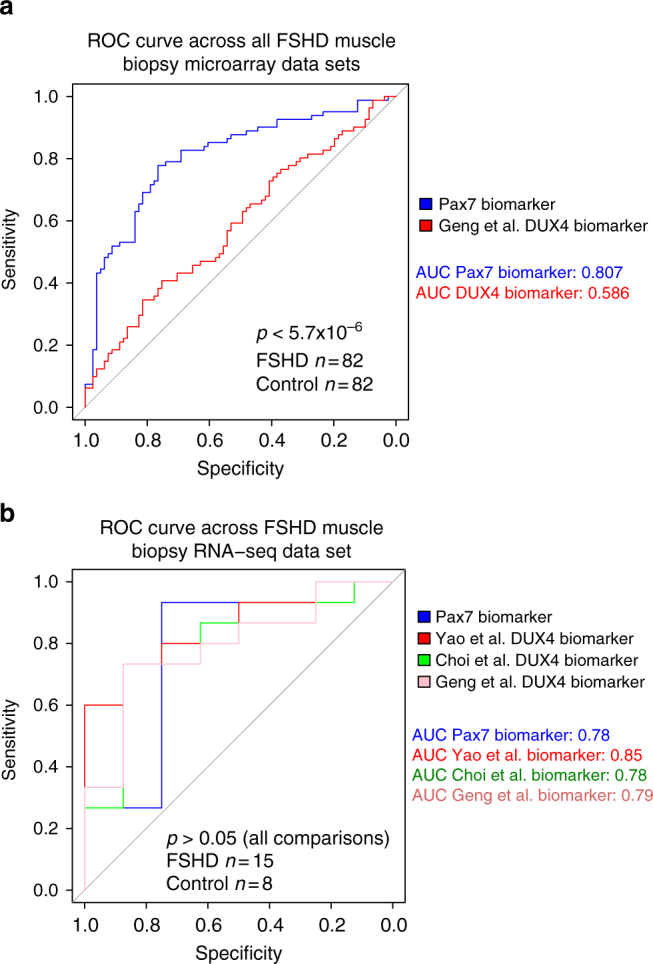
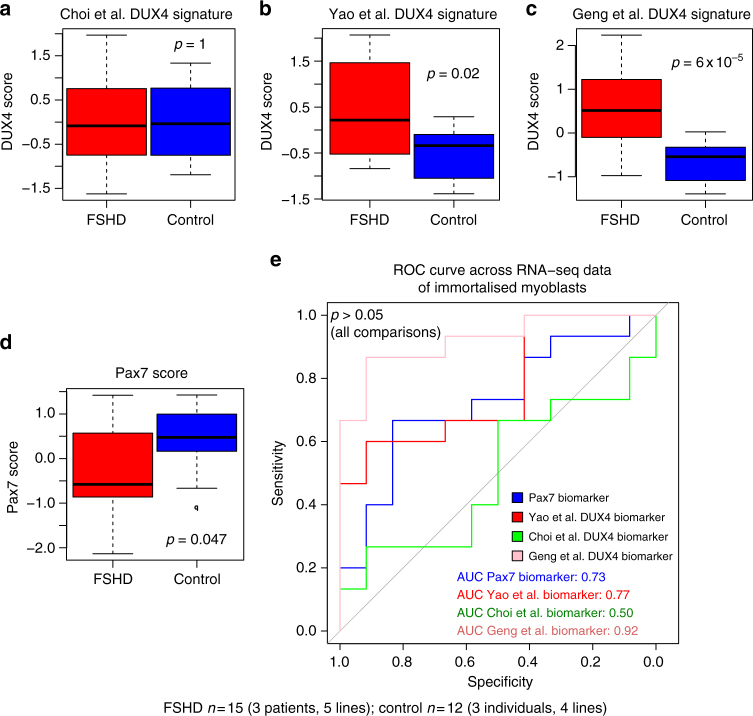
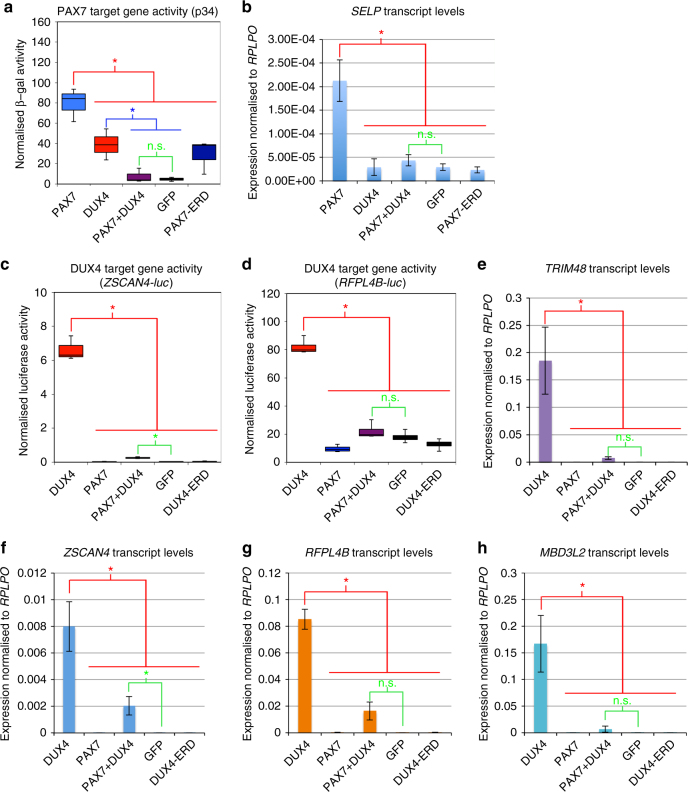
Facioscapulohumeral muscular dystrophy (FSHD) is a prevalent, incurable myopathy, linked to hypomethylation of D4Z4 repeats on chromosome 4q causing expression of the DUX4 transcription factor. However, DUX4 is difficult to detect in FSHD muscle biopsies and it is debatable how robust changes in DUX4 target gene expression are as an FSHD biomarker. PAX7 is a master regulator of myogenesis that rescues DUX4-mediated apoptosis. Here, we show that suppression of PAX7 target genes is a hallmark of FSHD, and that it is as major a signature of FSHD muscle as DUX4 target gene expression. This is shown using meta-analysis of over six FSHD muscle biopsy gene expression studies, and validated by RNA-sequencing on FSHD patient-derived myoblasts. DUX4 also inhibits PAX7 from activating its transcriptional target genes and vice versa. Furthermore, PAX7 target gene repression can explain oxidative stress sensitivity and epigenetic changes in FSHD. Thus, PAX7 target gene repression is a hallmark of FSHD that should be considered in the investigation of FSHD pathology and therapy.


Conflict of interest statement

The authors declare no competing financial interests.

Figures

Fig. 1
Fig. 1
Reported FSHD biomarkers do not validate on most published FSHD muscle biopsy gene expression data sets. a Box plot confirms that the Yao et al. DUX4 114 target gene signature validates as a biomarker on the RNA-seq FSHD muscle biopsy data set published by Yao et al.. The box represents the interquartile range (IQR), with the median indicated by a line. Whiskers denote min (1.5*IQR, max (observed value)). ‘‘o’’ represents data points greater than 1.5 IQR from the median, n = 15 FSHD and n = 8 control muscle biopsies. b A forest plot displays the results of meta-analysis of the discriminatory power of the Yao et al. DUX4 target gene signature across five published microarray FSHD muscle biopsy data sets (in total n = 82 FSHD and n = 82 control muscle biopsies). The differential scores (FSHD score minus control score) alongside 95% confidence intervals are provided. c A box plot confirms that the Rahimov et al. FSHD 15 gene biomarker validates as a biomarker on the microarray FSHD muscle biopsy discovery data set published by Rahimov et al.. The box represents the interquartile range (IQR), with the median indicated by a line. Whiskers denote min (1.5*IQR, max (observed value)). ‘‘o’’ represents data points greater than 1.5 IQR from the median, n = 26 FSHD and n = 24 control muscle biopsies. d A forest plot displays the results of meta-analysis of the discriminatory power of the Rahimov et al. FSHD biomarker across four published microarray and one RNA-seq FSHD muscle biopsy data sets (in total n = 71 FSHD and n = 66 control muscle biopsies). The differential scores (FSHD score minus control score) alongside 95% confidence intervals are provided. Neither biomarker is able to discriminate FSHD from control samples on meta-analysis. However, both are able to discriminate on the Tasca et al. MRI-guided muscle biopsy microarray data set. For single studies a two-tailed Wilcoxon U-test was performed to assess significance, while a Fisher’s combined test was employed for overall assessment: either the p-value is given, or an asterisk denotes p < 0.05
Fig. 2
Fig. 2
Novel DUX4 target gene signatures only discriminate some FSHD muscle biopsy gene expression data sets from controls. a A box plot demonstrates that the Choi et al. RNA-seq-based 212 DUX4 target gene signature validates as a biomarker on the RNA-seq FSHD muscle biopsy data set published by Yao et al.. The box represents the interquartile range (IQR), with the median indicated by a line. Whiskers denote min (1.5*IQR, max (observed value)). ‘‘o’’ represents data points greater than 1.5 IQR from the median, n = 15 FSHD and n = 8 control muscle biopsies. b A forest plot displays the results of meta-analysis of the discriminatory power of the Choi et al. DUX4 target gene signature across five published microarray FSHD muscle biopsy data sets (in total n = 82 FSHD and n = 82 control muscle biopsies). The differential scores (FSHD score minus control score) alongside 95% confidence intervals are provided. The Choi et al. DUX4 target gene signature is not a significant biomarker on any microarray data set nor on meta-analysis. Note: in the Choi et al. study, target genes were analysed after 8 h of DUX4 induction. c A box plot demonstrates that the Geng et al. microarray based 165 DUX4 target gene signature validates as a biomarker on the RNA-seq FSHD muscle biopsy data set published by Yao et al.. The box represents the interquartile range (IQR), with the median indicated by a line. Whiskers denote min (1.5*IQR, max (observed value)). ‘‘o’’ represents data points greater than 1.5 IQR from the median, n = 15 FSHD and n = 8 control muscle biopsies. d A forest plot displays the results of meta-analysis of the discriminatory power of the Geng et al. DUX4 target gene signature across five published microarray FSHD muscle biopsy data sets (in total n = 82 FSHD and n = 82 control muscle biopsies). The differential scores (FSHD score minus control score) alongside 95% confidence intervals are provided. The Geng et al. DUX4 target gene signature is not a significant biomarker on any individual microarray data set, however, it is significant on meta-analysis. For single studies a two-tailed Wilcoxon U-test was performed to assess significance, while a Fisher’s combined test was employed for overall assessment: either the p-value is given, or an asterisk denotes p < 0.05
Fig. 3
Fig. 3
PAX7 target gene signature is a robust hallmark of FSHD skeletal muscle. a Gene set enrichment analysis was performed separately for activated and repressed targets of PAX7 against the Molecular Signatures database (MSigDB), . Gene sets in MSigDB are frequently partitioned into ‘‘genes upregulated in phenotype’’ and ‘‘genes downregulated in phenotype’’. If such opposing gene sets were inversely significantly enriched across activated and repressed PAX7 targets (as assessed by Fisher’s exact test), they were considered robust. A bar plot displays the −log10 (enrichment p-value) for PAX7 robust gene sets. A horizontal green line denotes p = 0.05. UP and DOWN on the x-axis refers to the partition of labeled gene sets into genes positively and negatively associated with the gene set respectively. PAX7 targets are enriched for repression of a HYPOXIA gene set, which specifically describes genes upregulated and downregulated following over-expression of a constitutively active form of HIF1α. Another gene set affected by PAX7 repression is EZH2 target genes. b A box plot demonstrates that the PAX7 target gene signature derived from 311 upregulated target genes and 290 downregulated target genes, validates as a biomarker on the RNA-seq FSHD muscle biopsy data set published by Yao et al.. The box represents the interquartile range (IQR), with the median indicated by a line. Whiskers denote min (1.5*IQR, max (observed value)). ‘‘o’’ represents data points greater than 1.5 IQR from the median, n = 15 FSHD and n = 8 control muscle biopsies. The two-tailed Wilcoxon U-test p-value is given. c A forest plot displays the results of meta-analysis of the discriminatory power of the PAX7 target gene signature across five published microarray FSHD muscle biopsy data sets (in total n = 82 FSHD and n = 82 control muscle biopsies). The differential scores (FSHD score minus control score) alongside 95% confidence intervals are provided. Our PAX7 target gene signature is a significant biomarker on every individual FSHD muscle biopsy data set, and is strongly significant on meta-analysis. For single studies, a two-tailed Wilcoxon U-test was performed to assess significance, while a Fisher’s combined test was employed for overall assessment: *denotes p < 0.05, **denotes p < 0.01 and ***denotes p < 0.001
Fig. 4
Fig. 4
PAX7 target gene repression is an equivalent FSHD biomarker to DUX4 target gene expression. a A ROC curve compares the discriminatory power of our PAX7 biomarker with the DUX4 target gene signature that we derived from Geng et al., across five microarray data sets (in total n = 82 FSHD and n = 82 control muscle biopsies). De-Long’s test p-value is given and demonstrates that the PAX7 biomarker is a significantly better discriminator of FSHD status. b A ROC curve compares the discriminatory power of our PAX7 biomarker with the DUX4 target gene signatures that we derived from Geng et al. and Choi et al. and that described in Yao et al. across the RNA-seq data set of n = 15 FSHD and n = 8 control muscle biopsies. De-Long’s test reveals no significant differences in the discriminatory power of these four biomarkers
Fig. 5
Fig. 5
PAX7 and DUX4 target gene biomarkers validate on FSHD myoblast gene expression data sets. Box plots show the a Choi et al., b Yao et al. and c Geng et al. DUX4 target gene signatures and d our PAX7 biomarker, computed for five FSHD patient lines and four matched control lines corresponding to three patients and controls RNA-sequenced in triplicate (in total n = 15 FSHD and n = 12 Control). In line with previous findings, PAX7 repression and DUX4 expression as assessed by the Yao et al. and Geng et al. DUX4 target signatures are significant biomarkers of FSHD status. The Choi et al. DUX4 target gene biomarker is not a significant discriminator of FSHD status, where target genes were identified after 8 h of DUX4 induction. The box represents the interquartile range (IQR), with the median indicated by a line. Whiskers denote min (1.5*IQR, max (observed value)). ‘‘o’’ represents data points greater than 1.5 IQR from the median. The two-tailed Wilcoxon U-test p-value is given. e A ROC curve compares the discriminatory power of our PAX7 biomarker with the Geng et al., Choi et al. and Yao et al. DUX4 target gene signatures across the RNA-seq data set of FSHD and control immortalised myoblasts. De-Long’s test reveals no significant differences in the discriminatory power of these three DUX4 and one PAX7 biomarkers
Fig. 6
Fig. 6
Co-expression of PAX7 and DUX4 causes suppression of the transcriptional activity of both proteins. HEK-293 or NIH-3T3 cells were transfected with plasmids encoding DUX4, Pax7, DUX4 and Pax7, or dominant negative-version DUX4-ERD, or Pax7-ERD. a The ability of PAX7 to activate its transcriptional target genes was measured via the p34 plasmid driving lacZ, co-transfected with the constructs listed above, together with a control RSV luciferase plasmid as a transfection normaliser, into NIH-3T3 cells. Reporter gene intensities were measured using a Glomax-Multi + plate reader and normalised to RSV luciferase. PAX7 activated the p34 PAX7 reporter construct, but both PAX7 and DUX4 together suppressed activity of this PAX7 reporter compared to PAX7 alone. b RT-qPCR for PAX7 transcriptional target gene SELP confirms that co-expression of Pax7 and DUX4 suppresses the activation of this endogenous PAX7 transcriptional target compared to PAX7 alone, in HEK-293. The ability of DUX4 to activate its transcriptional target genes was measured via two separate DUX4 reporter constructs: c ZSCAN4-luc and d RFPL4B-luc, both controlling a luciferase reporter gene, co-transfected with DUX4 and/or Pax7 constructs, or DUX4-ERD or GFP, together with a RSV lacZ as a transfection normaliser, into HEK-293. Reporter gene intensities were measured using a Glomax-Multi + plate reader and normalised to β-galactosidase activity. While DUX4 activated both DUX4 reporters, both PAX7 and DUX4 together, suppressed activity of these DUX4 reporters compared to DUX4 alone. RT-qPCR for DUX4 endogenous transcriptional target genes. e TRIM48, f ZSCAN4, g RFPL4B and h MBD3L2 confirms that the presence of both PAX7 and DUX4 together suppresses activation of all these endogenous DUX4 transcriptional target genes compared to the levels achieved by DUX4 alone in HEK-293 cells. Boxes represents the interquartile range (IQR), with the median indicated by a line. Whiskers denote min (1.5*IQR, max (observed value)). For bar graphs, error bars denote standard error of the mean, n = 3 or 4 for each cell line, ANOVA revealed significant intensity differences, post hoc unpaired two tailed t-tests were employed to assess significant pairwise differences: *denotes p < 0.05, and n.s. denotes non-significance of pairwise t-tests

References

    1. Deenen JC, et al. Population-based incidence and prevalence of facioscapulohumeral dystrophy. Neurology. 2014;83:1056–1059. doi: 10.1212/WNL.0000000000000797. - DOI - PMC - PubMed
    1. Orrell RW. Facioscapulohumeral dystrophy and scapuloperoneal syndromes. Handb. Clin. Neurol. 2011;101:167–180. doi: 10.1016/B978-0-08-045031-5.00013-X. - DOI - PubMed
    1. Rahimov F, et al. Transcriptional profiling in facioscapulohumeral muscular dystrophy to identify candidate biomarkers. Proc. Natl Acad. Sci. USA. 2012;109:16234–16239. doi: 10.1073/pnas.1209508109. - DOI - PMC - PubMed
    1. Fitzsimons RB, Gurwin EB, Bird AC. Retinal vascular abnormalities in facioscapulohumeral muscular dystrophy. A general association with genetic and therapeutic implications. Brain. 1987;110:631–648. doi: 10.1093/brain/110.3.631. - DOI - PubMed
    1. Lutz KL, Holte L, Kliethermes SA, Stephan C, Mathews KD. Clinical and genetic features of hearing loss in facioscapulohumeral muscular dystrophy. Neurology. 2013;81:1374–1377. doi: 10.1212/WNL.0b013e3182a84140. - DOI - PMC - PubMed

Publication types