. 2018 Feb;2(2):377-387.
doi: 10.1038/s41559-017-0419-9. Epub 2017 Dec 18.

Adaptation of Plasmodium falciparum to its transmission environment

Affiliations

Adaptation of Plasmodium falciparum to its transmission environment

Martin K Rono et al. Nat Ecol Evol. 2018 Feb.

Abstract

Success in eliminating malaria will depend on whether parasite evolution outpaces control efforts. Here, we show that Plasmodium falciparum parasites (the deadliest of the species causing human malaria) found in low-transmission-intensity areas have evolved to invest more in transmission to new hosts (reproduction) and less in within-host replication (growth) than parasites found in high-transmission areas. At the cellular level, this adaptation manifests as increased production of reproductive forms (gametocytes) early in the infection at the expense of processes associated with multiplication inside red blood cells, especially membrane transport and protein trafficking. At the molecular level, this manifests as changes in the expression levels of genes encoding epigenetic and translational machinery. Specifically, expression levels of the gene encoding AP2-G-the transcription factor that initiates reproduction-increase as transmission intensity decreases. This is accompanied by downregulation and upregulation of genes encoding HDAC1 and HDA1-two histone deacetylases that epigenetically regulate the parasite's replicative and reproductive life-stage programmes, respectively. Parasites in reproductive mode show increased reliance on the prokaryotic translation machinery found inside the plastid-derived organelles. Thus, our dissection of the parasite's adaptive regulatory architecture has identified new potential molecular targets for malaria control.


Conflict of interest statement

competing interests

The authors declare no competing financial interests.

Figures

Fig. 1
Fig. 1. Experimental design and analysis.
a, P. falciparum parasites were sampled from three pairs of high (H) versus low (L) transmission populations in East Africa separated by space and time. b, Transcriptional profile (log2 expression values relative to the reference isolate) for an example gene (PF11_0513) during the 48 h asexual stage maturation cycle. Dots represent observed values (orange, high transmission; blue, low transmission), while the black line shows the Loess fitted curve. Analysis of the curve’s residual values revealed highly significant upregulation of this gene in high-transmission versus low-transmission populations (right panel: mean and 95% confidence intervals; P < 0.001 by significance test 2; see Methods). c, Overview of the data analysis.
Fig. 2
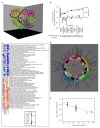
Fig. 2. Full-genome gene correlation network.
a, Network of co-regulated genes coloured by module. The network is built from the strongest 5% of linkages between genes and this visual representation includes only genes with at least 50 connections (n = 3,401 out of 4,615 genes). The black curved lines approximately delineate the three life stages: asexual forms in the blood (maroon, pale green, magenta and forest green), mosquito stages (khaki and goldenrod) and liver stages (lime green, dark blue, cornflower blue, purple and pink) (Supplementary Fig. 8). Sexual stages in the blood and early in the mosquito phase occupy the periphery (turquoise, yellow and tomato). b, Proportion of network modules with significant H–L-regulated genes (P < 0.05 by significance test 2), ordered from left to right by the module’s average network connectivity, an index that negatively relates to occupancy of the network’s periphery. c, Heat map showing significance (orange–blue colour legend) for genes with consistent H–L differences in the three experiments (significance test 1; first three columns) and across experiments (by significance tests 2 and 3; last two columns). The colour bar on the left side indicates the network module in a to which each gene belongs. d, Functional enrichment of H–L significant genes (P < 0.05 by test 2). The bar heights on the inner two tracks indicate the proportion of 171 analysis combinations, scaled from 0 to 0.5, with significant enrichment (P < 0.05 by membership enrichment test) of H–L genes (upregulated, orange; downregulated, blue) in each of 255 small functional groups (Supplementary Table 7) delineated by tick marks. Large and medium functional groups are indicated by the outer coloured track (coloured segments and adjacent labels) and inner grey-scale tracks (n = 32; black radiating labels), respectively. The third-from-outside track indicates the network module most strongly enriched for the small functional group. More details relating the network modules to functional groups are given in Supplementary Fig. 9. e, Across-experiment regression of expression ratios on transmission intensity (by significance test 3) for the AP2-g gene (PFL1085w). Coloured dots and vertical bars indicate means and 95% confidence intervals for high- (red colours) and low-transmission (blue colours) populations in each of the three experiments.
Fig. 3
Fig. 3. Epigenetic and translation machinery networks.
a-d, Sub-network of genes coding for epigenetic and translational machinery alongside highly significant H–L-regulated genes (P < 0.01 by test 2), coloured by network module (a), H–L significance (b; see legend), classes of epigenetic machinery (c) and translational machinery (d; legends in panel e). Key genes mentioned in the main text are labelled with their abbreviated names (Supplementary Table 8). Symbol shapes indicate cellular location (square, mitochondrion; triangle, apicoplast; circle, cytosol). e, Connectivity of epigenetic machinery (right sector) and translational machinery genes (left sector). Colours in the outer three tracks show the H–L significance (legend in panel b), network module and class of epigenetic machinery and translational machinery, respectively. The next track (grey bars) shows the numbers of connections to all other genes as a proportion of all genes (range 0–0.25). The inner three tracks show the ratio of the observed to expected number of connections to H–L-upregulated genes (orange), H–L downregulated genes (blue), epigenetic machinery genes (gold) and translational machinery genes (dark gold) on a log2 scale, ranging from 0 to 1. Ribosomal proteins in the bottom 80% for global connectivity were excluded in e.
Fig. 4
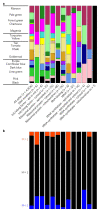
Fig. 4. I Enrichment of organellar translation genes in downregulated H–l genes and sexual-stage network modules.
a, Distribution of classes of translation machinery genes (xaxis; Supplementary Table 8) across network modules (yaxis). Horizontal lines on the y axis delineate asexual blood stages, sexual blood stages, mosquito stages and liver stages, from top to bottom (Supplementary Table 6). b, Proportions of H-L-upregulated, -downregulated and -non-regulated genes by translation machinery classes (shared xaxis with a). api, apicoplast; iMet, initiator methionine; mit, mitochondrion.
Fig. 5
Fig. 5. Selection for environment-specific levels of replication and reproduction under two different trade-off models.
Differential selection (orange and blue vertical arrows) acting on life-history trade-offs leads to different optimal levels of replication in high- versus low-transmission environments (orange and blue lines and text). a, Under model 1, a direct trade-off between replication and reproduction, indicated by a single asterisk, arises from the fact that gametocytes, which are formed from asexual parasites, do not replicate. Theoretical models and empirical data have shown that low investment in reproduction (higher investment in replication) early in the infection leads to larger asexual populations and thus more gametocytes later in the infection, thus creating a trade-off between future and current reproduction,. When host immunity and within-host competition, as occur in high-transmission areas, impose greater demands on replication ability, lower reproductive investment early in the infection is favoured, thus creating different outcomes in high- versus low-transmission environments (crossed blue and orange lines). b, Under model 2, a higher asexual replication rate is assumed to lead to more gametocytes throughout the infection (parallel orange and blue lines) and/or longer infections (persistence), but the trade-off (double asterisk) is the higher risk of host death (virulence), which causes zero transmission. In high-transmission areas, where immunity protects hosts from dying, the cost of virulence is reduced, thus allowing higher replication rates to evolve. Model 2, like model 1, predicts that in-host competition will further drive replication upwards in high-transmission areas. Note that the model 2 trade-off may also operate within model 1 (dotted arrows) and vice versa without altering their individual predictions of higher early asexual replication in high-transmission environments. Traits that impact fitness through early-life decisions are shown in green. Fitness–trait relationships considered to be most influential under the model in question are shown with larger ‘+ ’ or ‘-‘ symbols.

References

    1. Stearns SC. The Evolution of Life Histories. Oxford Univ. Press; New York: 1992.
    1. Reece SE, Ramiro RS, Nussey DH. Plastic parasites: sophisticated strategies for survival and reproduction? Evol Appl. 2009;2:11–23. - PMC - PubMed
    1. Mideo N, Day T. On the evolution of reproductive restraint in malaria. Proc R Soc B; 2008. pp. 1217–1224. - PMC - PubMed
    1. Gandon S, Mackinnon MJ, Nee S, Read AF. Imperfect vaccines and the evolution of parasite virulence. Nature. 2001;414:751–755. - PubMed
    1. Noor AM, et al. The changing risk of Plasmodium falciparum malaria infection in Africa: 2000-10: a spatial and temporal analysis of transmission intensity. Lancet. 2014;383:1739–1747. - PMC - PubMed

Publication types

MeSH terms