. 2017 Dec 4:8:968.
doi: 10.3389/fphys.2017.00968. eCollection 2017.

Comparative Analysis of Muscle Hypertrophy Models Reveals Divergent Gene Transcription Profiles and Points to Translational Regulation of Muscle Growth through Increased mTOR Signaling

Affiliations

Comparative Analysis of Muscle Hypertrophy Models Reveals Divergent Gene Transcription Profiles and Points to Translational Regulation of Muscle Growth through Increased mTOR Signaling

Marcelo G Pereira et al. Front Physiol. .

Abstract

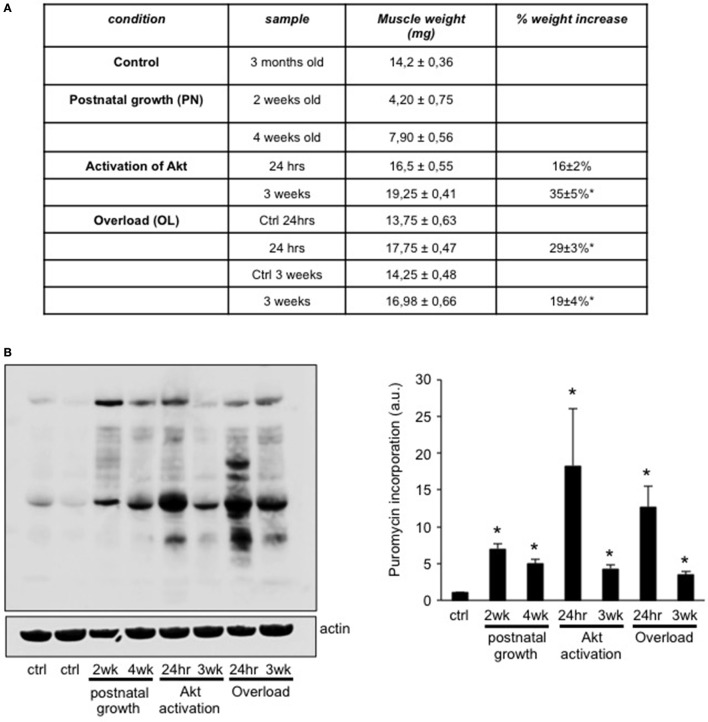
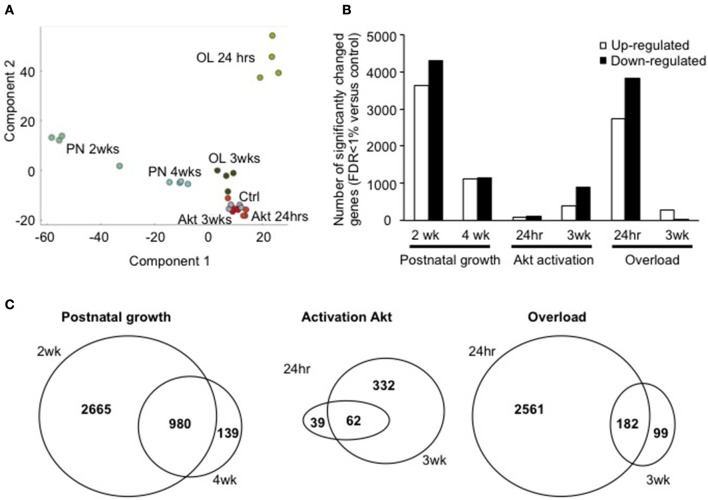
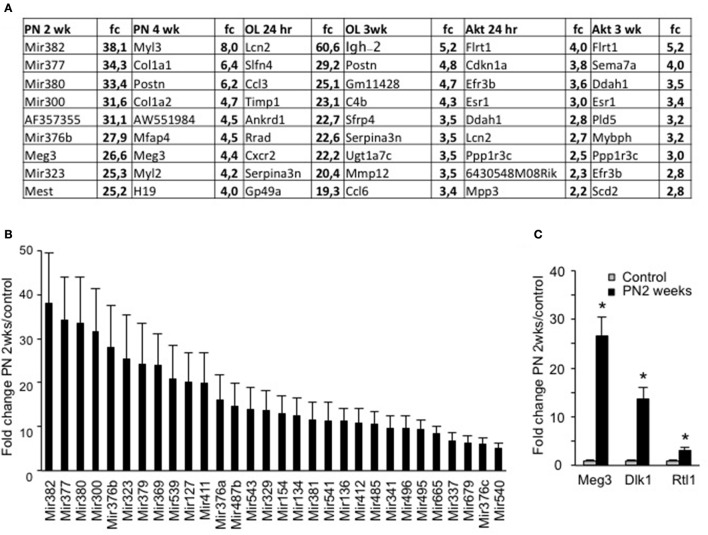
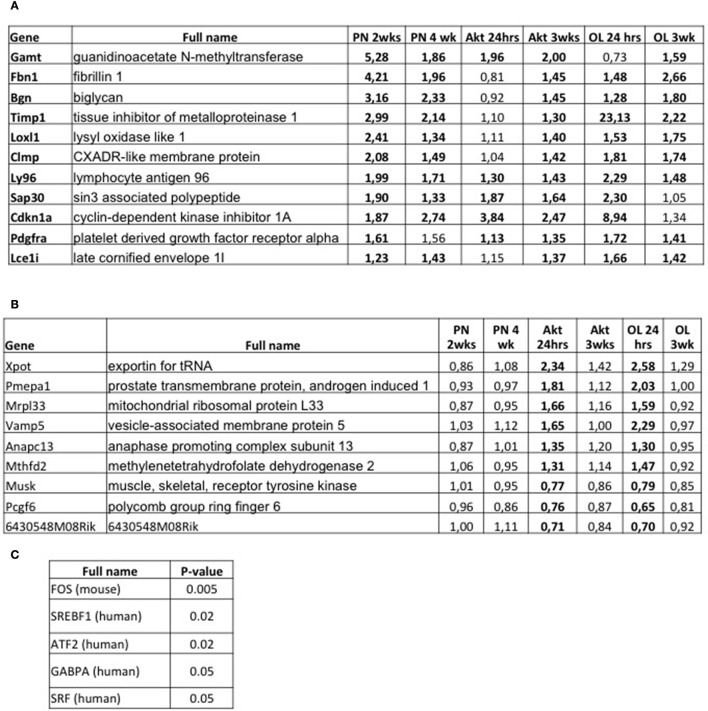
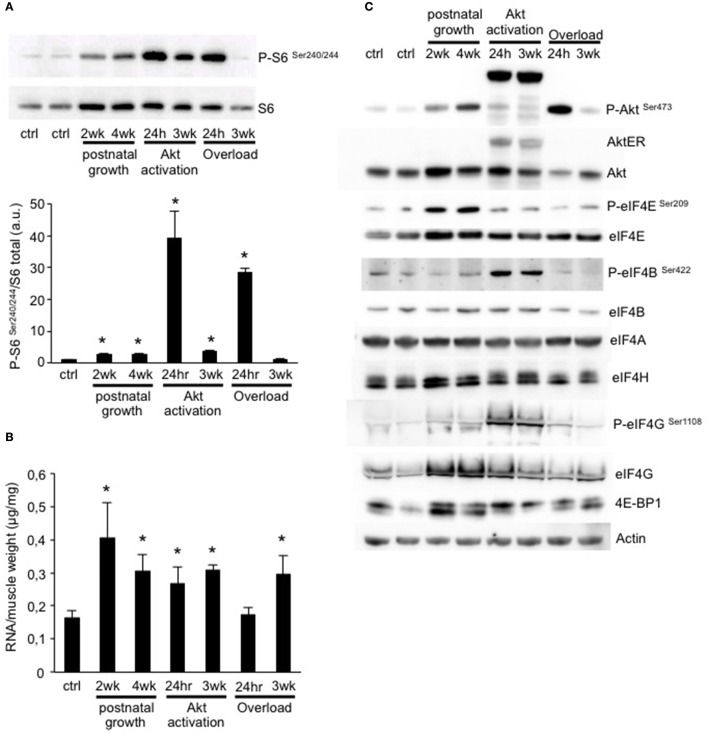
Skeletal muscle mass is a result of the balance between protein breakdown and protein synthesis. It has been shown that multiple conditions of muscle atrophy are characterized by the common regulation of a specific set of genes, termed atrogenes. It is not known whether various models of muscle hypertrophy are similarly regulated by a common transcriptional program. Here, we characterized gene expression changes in three different conditions of muscle growth, examining each condition during acute and chronic phases. Specifically, we compared the transcriptome of Extensor Digitorum Longus (EDL) muscles collected (1) during the rapid phase of postnatal growth at 2 and 4 weeks of age, (2) 24 h or 3 weeks after constitutive activation of AKT, and (3) 24 h or 3 weeks after overload hypertrophy caused by tenotomy of the Tibialis Anterior muscle. We observed an important overlap between significantly regulated genes when comparing each single condition at the two different timepoints. Furthermore, examining the transcriptional changes occurring 24 h after a hypertrophic stimulus, we identify an important role for genes linked to a stress response, despite the absence of muscle damage in the AKT model. However, when we compared all different growth conditions, we did not find a common transcriptional fingerprint. On the other hand, all conditions showed a marked increase in mTORC1 signaling and increased ribosome biogenesis, suggesting that muscle growth is characterized more by translational, than transcriptional regulation.

Keywords: Akt; hypertrophy; immediate early genes; mTORC1; overload; postnatal growth; ribosome biogenesis; skeletal muscle.


Figures

Figure 1
Figure 1
Different models of muscle growth show an increase in protein synthesis rates. (A) Table summarizing the weight of the EDL muscles taken out in the six different conditions of muscle growth and control muscles. (B) In order to determine the protein synthesis rate in each EDL muscle in the different conditions we injected puromycin 30 min before taking out the muscles. As can be seen in the representative blot and quantification, all conditions show a significant increase in protein synthesis rates compared to control muscles (n = 4 for each group, *P < 0.05).
Figure 2
Figure 2
The number of significantly regulated genes varies between growth models. (A) Principal component analysis shows the group wise distribution of each individual sample. It can be appreciated how each individual sample clusters with the other samples from the same group, and how each group is distinct from the other (B) number of significantly up-and-down-regulated genes in each condition (C) overlap between two different time points of the same growth stimulus. A significant amount of overlap exists in postnatal growth (2, 4 weeks), Akt activation (24 h, 3 weeks of activation), and overload hypertrophy due to tenotomy of the TA tendon (24 h, 3 weeks).
Figure 3
Figure 3
Evaluation of top-ranked genes shows a significant increase in a miRNA megacluster in muscle from postnatal 2 weeks. (A) Top ranked significantly increased genes from each condition as compared to control samples. (B) Fold change (fc) of 30 miRNAs which showed at least a significant 5-fold change in expression levels in postnatal growth 2 weeks, but in no other condition. (C) Fold change of three genes expressed in the same region of the DNA as the miRNA mega cluster, namely the Dlk1-Dio3 locus (n = 4 for each group, *P < 0.05).
Figure 4
Figure 4
Comparative transcriptome analyses of all models of muscle growth and early signals inducing muscle hypertrophy. (A) Table indicating all genes which showed a significant upregulation in at least five of the six growth conditions. Significant changes are shown in bold. (B) List of genes which are significantly regulated in Akt 24 h and OL 24 h (in bold), and not in the other growth conditions. These genes are early responsive genes to an acute hypertrophic stimulus. (C) TRANSFAC analyses of the genes reported in (B) shows a list of five transcription factors whose activity is significantly altered in the early hypertrophic response.
Figure 5
Figure 5
Muscle growth is characterized by an increase in ribosome biogenesis and mTOR signaling. (A) Representative blot and quantification of ribosomal protein S6 phosphorylation shows a significant increase in all conditions, except for 3 weeks OL. (B) Quantification of the total amount of RNA per muscle weight. All conditions show a significant increase compared to control muscles, except for 24 h OL. (C) Representative western blots of the activation of Akt-mTOR signaling and translation initiation factors in all conditions (*P < 0.05, n = 4 per group).

References

    1. Alain T., Morita M., Fonseca B. D., Yanagiya A., Siddiqui N., Bhat M., et al. . (2012). eIF4E/4E-BP ratio predicts the efficacy of mTOR targeted therapies. Cancer Res. 72, 6468–6476. 10.1158/0008-5472.CAN-12-2395 - DOI - PubMed
    1. Amthor H., Macharia R., Navarrete R., Schuelke M., Brown S. C., Otto A., et al. . (2007). Lack of myostatin results in excessive muscle growth but impaired force generation. Proc. Natl. Acad. Sci. U.S.A. 104, 1835–1840. 10.1073/pnas.0604893104 - DOI - PMC - PubMed
    1. Barbé C., Bray F., Gueugneau M., Devassine S., Lause P., Tokarski C., et al. . (2017). Comparative proteomic and transcriptomic analysis of follistatin-induced skeletal muscle hypertrophy. J. Proteome Res. 16, 3477–3490. 10.1021/acs.jproteome.7b00069 - DOI - PubMed
    1. Ben-Sahra I., Hoxhaj G., Ricoult S. J. H., Asara J. M., Manning B. D. (2016). mTORC1 induces purine synthesis through control of the mitochondrial tetrahydrofolate cycle. Science 351, 728–733. 10.1126/science.aad0489 - DOI - PMC - PubMed
    1. Blaauw B., Canato M., Agatea L., Toniolo L., Mammucari C., Masiero E., et al. . (2009). Inducible activation of Akt increases skeletal muscle mass and force without satellite cell activation. FASEB J. 23, 3896–3905. 10.1096/fj.09-131870 - DOI - PubMed

LinkOut - more resources