. 2017 Dec 13:13:112.
doi: 10.1186/s13007-017-0257-4. eCollection 2017.

Comparison of mitochondrial gene expression and polysome loading in different tobacco tissues

Affiliations

Comparison of mitochondrial gene expression and polysome loading in different tobacco tissues

Muhammad Waqar Hameed et al. Plant Methods. .

Abstract

Background: To investigate translational regulation of gene expression in plant mitochondria, a mitochondrial polysome isolation protocol was established for tobacco to investigate polysomal mRNA loading as a proxy for translational activity. Furthermore, we developed an oligonucleotide based microarray platform to determine the level of Nicotiana tabacum and Arabidopsis thaliana mitochondrial mRNA.

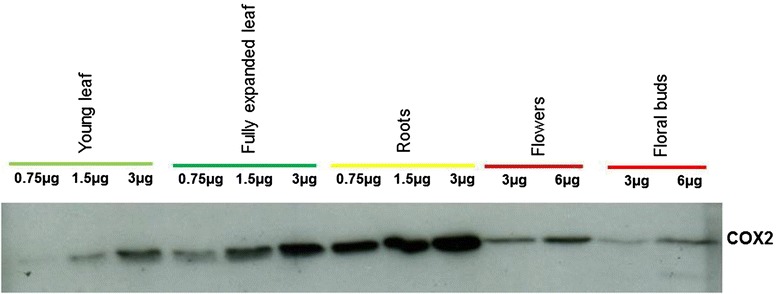
Results: Microarray analysis of free and polysomal mRNAs was used to characterize differences in the levels of free transcripts and ribosome-bound mRNAs in various organs of tobacco plants. We have observed higher mitochondrial transcript levels in young leaves, flowers and floral buds as compared to fully expanded leaves and roots. A similar pattern of abundance was observed for ribosome-bound mitochondrial mRNAs in these tissues. However, the accumulation of the mitochondrial protein COX2 was found to be inversely related to that of its ribosome-bound mRNA.

Conclusions: Our results indicate that the association of mitochondrial mRNAs to ribosomes is largely determined by the total transcript level of a gene. However, at least for Cox2, we demonstrated that the level of ribosome-bound mRNA is not reflected by the amount of COX2 protein.

Keywords: Mitochondrial microarray; Mitochondrial ribosomes; Plant mitochondria; Transcription; Translation.


Figures

Fig. 1
Fig. 1
Optimization of the digitonin concentration for mitochondrial polysome isolation. To improve the extraction efficiency of the membrane-bound mitochondrial ribosomes, the detergent digitonin was added to the extraction buffer. The extraction efficiency of mitochondrial ribosomes was checked by hybridization to a specific probe for the mitochondrial cox1 gene (a). As the original protocol had been optimized for the isolation of plastidial polysomes, the influence of increased digitonin concentrations on plastidial ribosomes was determined by using a psbA gene specific probe as a control (b). Blots under the heading “mitochondrial probe cox1” (a) and “plastid probe psbA” (b) indicate two sets of parallel experiments for the optimization of digitonin concentrations. Blots under the  label “minus puromycin” indicate the polysome purification experiment and those under the label “plus puromycin” are controls to identify light and heavy polysomal fractions. In both a and b set of blots (i) represents polysome isolation procedure using a protocol suitable for plastidial polysomes where lanes 1–10 represent the different polysomal fractions. (ii) Polysome isolation by supplementing the extraction buffer with 50 mg/ml digitonin. (iii) Polysome isolation by the addition of 60 mg/ml digitonin to the extraction buffer. (iv) Polysome isolation using 75 mg/ml digitonin in the extraction buffer
Fig. 2
Fig. 2
Mitochondrial RNA abundance in tobacco organs. RNA levels of mitochondrial transcripts in young leaves, fully expanded leaves, roots, flowers and floral buds. Values represent relative transcript levels per µg of total RNA (Additional file 5: Dataset 1). Data represent mean values of four biological replicates for young leaves and fully expanded leaves, three biological replicates for roots and flowers, and two biological replicates for floral buds. Significant changes were calculated using Two way ANOVA (p < 0.05). Significant changes relative to roots are marked by asterisks (*)
Fig. 3
Fig. 3
Northern blot analysis of mitochondrial RNA abundance in tobacco organs. a The analyzed tissues are indicated above the blots. Three mitochondrial genes (cox1, atp9 and rps10) were analyzed to confirm the pattern of mitochondrial mRNA abundance observed through mitochondrial microarray analysis. Equal loading of RNA was checked through 18S rRNA hybridization. The blots are representatives for three independent replicates. b Signal intensities relative to the 18s rRNA control from the Northern blots presented in part a of this figure. Pixel intensity values as determined using ImageJ were used to calculate the ratios
Fig. 4
Fig. 4
Determination of mitochondrial DNA content per nuclear DNA and the expression analysis of RpoT genes in tobacco organs using qRT-PCR analysis. Young tobacco leaves, fully expanded leaves, roots, flowers and floral buds were assayed for mitochondrial DNA content relative to nuclear DNA content (A). Primer combination was chosen from mitochondrial intergenic region orf112b to cob (position 34,443–40,865) and from a nuclear non-coding region from RpoTm. Data were determined by calculating the difference of mitochondrial to nuclear CT values. Bars in the figure represent standard deviations for three biological replicates. B RpoTm, and C RpoTmp messenger RNA abundance was determined by quantitative real-time PCR. Data were normalized to cytoplasmic EF1α and GAPDH levels as an internal control. RpoT gene expression is presented as 40-ΔCT values. Given values were derived from three different biological replicates; standard deviations are indicated. Different letters mark mean values that are significantly different from each other (one way ANOVA; p < 0.05 followed by Tukey test)
Fig. 5
Fig. 5
Ribosome bound mRNA abundance in tobacco organs. Abundance of mRNA bound to ribosomes in young leaves, fully expanded leaves, roots, flowers and floral buds of tobacco. Values represent relative polysomal RNA levels per µg of ribosome-bound RNA (Additional file 7: Dataset 2). Data represent mean values of four biological replicates for young leaves and fully expanded leaves, three biological replicates for roots and flowers and two biological replicates for floral buds. Significance was estimated with two way ANOVA; P < 0.05. Significant changes relative to the roots are marked by asterisks (*)
Fig. 6
Fig. 6
Northern blot analysis of mitochondrial ribosome-bound mRNA levels in different tobacco organs. Polysome gradients were fractionated into ten fractions, and equal aliquots of extracted RNAs were separated by denaturing agarose gel electrophoresis, blotted, and hybridized to radiolabeled probes specific for cox1 (a) and atp9 (b) The wedges above the blots indicate the gradient from low to high sucrose concentration. As a control, a sample was treated with puromycin to cause dissociation of ribosomes from the mRNAs. Northern blots presented here are representatives for three independent technical replicates. c Quantification of the band intensities of ribosome-bound mRNA shown in the Northern blots above. Values represent the ratio between polysomal and non-polysomal bands
Fig. 7
Fig. 7
Western blot analysis to determine COX2 protein abundances in tobacco organs. Mitochondria isolated from young leaves, fully expanded leaves, roots, flowers and floral buds for western blot analysis using anti-COX2 antibody (provided by Prof. Thomas D. Fox, Cornell University, USA). For quantitative assessment of protein abundance in these tissues, dilution series of extracted mitochondrial proteins were loaded onto the gel for each tissue. Data were confirmed by analysis of three biological and technical replicates. Equal loading was further confirmed by silver staining of the gel

Similar articles

Cited by

References

    1. Dyall SD, Brown MT, Johnson PJ. Ancient invasions: from endosymbionts to organelles. Science. 2004;304(5668):253–257. doi: 10.1126/science.1094884. - DOI - PubMed
    1. Wernegreen JJ. Endosymbiosis. Curr Biol. 2012;22(14):R555–R561. doi: 10.1016/j.cub.2012.06.010. - DOI - PubMed
    1. Hager M, Bock R. Enslaved bacteria as new hope for plant biotechnologists. Appl Microbiol Biotechnol. 2000;54(3):302–310. doi: 10.1007/s002530000397. - DOI - PubMed
    1. Mackenzie SA. Plant organellar protein targeting: a traffic plan still under construction. Trends Cell Biol. 2005;15(10):548–554. doi: 10.1016/j.tcb.2005.08.007. - DOI - PubMed
    1. Murcha MW, Wang Y, Narsai R, Whelan J. The plant mitochondrial protein import apparatus—the differences make it interesting. BBA Gen Subj. 2014;1840(4):1233–1245. doi: 10.1016/j.bbagen.2013.09.026. - DOI - PubMed

LinkOut - more resources