Review
. 2017 Oct;7(5):452-462.
doi: 10.21037/cdt.2017.06.11.

Myocardial computed tomography perfusion

Affiliations
Review

Myocardial computed tomography perfusion

Kelley R Branch et al. Cardiovasc Diagn Ther. 2017 Oct.

Abstract

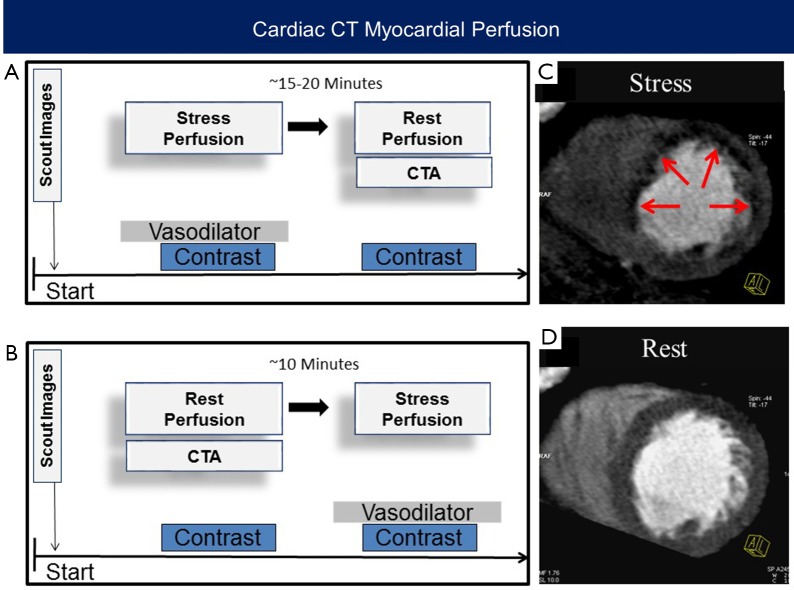
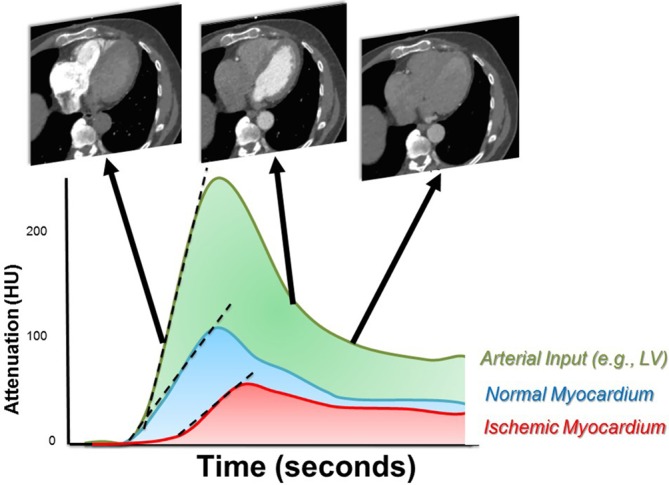
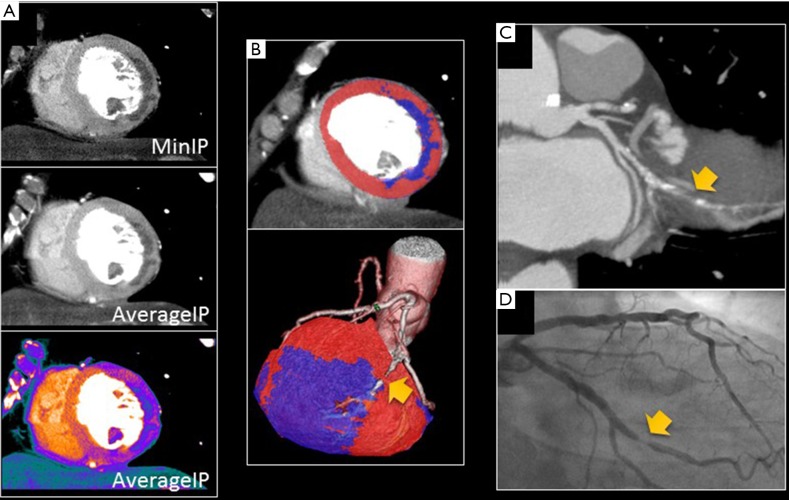
Despite having excellent diagnostic accuracy to detect anatomical coronary stenosis, coronary CT angiography (CTA) has a limited specificity to detect myocardial ischemia. CT perfusion (CTP) can identify myocardial perfusion defects during vasodilator stress, and when added to coronary CTA, improves the specificity of detecting hemodynamically significant stenosis. A CTP protocol typically involves the acquisition of two separate data sets: (I) a rest scan that can be used as both a coronary CTA and for evaluating rest myocardial perfusion, and (II) a stress CTP scan acquired during vasodilator stress testing. This review summarizes some the techniques, strengths, and limitations of CTP, and provides an overview of the recent evidence supporting the potential use of CTP in clinical practice.

Keywords: CT perfusion (CTP); Stress test; cardiac CT; ischemia; myocardial perfusion imaging.


Conflict of interest statement

Conflicts of Interest: The authors have no conflicts of interest to declare.

Figures

Figure 1
Figure 1
Example of two possible CT perfusion protocols. (A) stress first protocol—stress perfusion is completed first followed by a delay of 15–20 minutes and then rest perfusion and coronary CTA; (B) rest first protocol—rest perfusion and coronary CTA is completed first followed by stress perfusion; (C) the images on the right show stress CTP image which shows a perfusion defect throughout the anteroseptal, anterior, and anterolateral wall; (D) the same patient had a normal rest myocardial perfusion image with no defects. CTA, CT angiography; CTP, CT perfusion.
Figure 2
Figure 2
Time attenuation curves for normal myocardium (blue), ischemic myocardium (red) and the arterial input function (AIF; green). Representative CT images for certain time points are shown above the graph. The upslopes are represented by the dashed lines and are used to calculate semiquantitative myocardial blood flow. HU, Hounsfield units; LV, left ventricle.
Figure 3
Figure 3
Features that may be used in deciding whether to perform a stress-first or rest-first acquisition.
Figure 4
Figure 4
CT perfusion reconstructions in a patient with lateral wall infarction with (A) minimum intensity projection (MinIP) and average intensity projection grayscale and color HU map; (B) enhanced voxel distribution where >1 SD from the average HU of the myocardium shows blue suggesting hypoattenuation. High grade obtuse marginal stenosis (arrows) in the CT angiogram (C) and invasive coronary angiogram (D).
Figure 5
Figure 5
A 59-year-old obese man with no prior cardiac history who presented with chest pain and dyspnea on exertion. (A) A CT perfusion showed a large, severe perfusion defect in the anteroseptal, anterior, and anterolateral walls; (B) the CT angiography showed large non-calcified plaque in the proximal LAD; (C) SPECT MPI images with fully reversible defect throughout the mid and apical anterior wall; (D) invasive angiography in the left anterior oblique caudal view showing severe stenosis in LAD before the takeoff of the first diagonal branch. Reproduced from J Am Coll Cardiol (6) with permission from Elsevier.
Figure 6
Figure 6
CT perfusion artifacts with (A) beam hardening (arrow) in basal inferolateral wall due to interposed spine and contrast filled aorta and (B) banding artifact (arrows) due to differences in contrast uniformity during a scan acquisition with smaller detector scanners that requires multiple heart beats.

References

    1. Rossi A, Dharampal A, Wragg A, et al. Diagnostic performance of hyperaemic myocardial blood flow index obtained by dynamic computed tomography: does it predict functionally significant coronary lesions? Eur Heart J Cardiovasc Imaging 2014;15:85-94. 10.1093/ehjci/jet133 - DOI - PubMed
    1. Shreibati JB, Baker LC, Hlatky MA. Association of coronary CT angiography or stress testing with subsequent utilization and spending among Medicare beneficiaries. JAMA 2011;306:2128-36. 10.1001/jama.2011.1652 - DOI - PubMed
    1. Hulten E, Goehler A, Bittencourt MS, et al. Cost and resource utilization associated with use of computed tomography to evaluate chest pain in the emergency department. Circ Cardiovasc Qual Outcomes 2013;6:514-24. 10.1161/CIRCOUTCOMES.113.000244 - DOI - PMC - PubMed
    1. Bittencourt MS, Hulten EA, Murthy VL, et al. Clinical outcomes after evaluation of stable chest pain by coronary computed tomographic angiography versus usual care: a meta-analysis. Circ Cardiovasc Imaging 2016;9:e004419. 10.1161/CIRCIMAGING.115.004419 - DOI - PubMed
    1. Jørgensen ME, Andersson C, Nørgaard BL, et al. Functional testing or coronary computed tomography angiography in patients with stable coronary artery disease. J Am Coll Cardiol 2017;69:1761-70. 10.1016/j.jacc.2017.01.046 - DOI - PubMed

LinkOut - more resources