. 2018 Feb;15(2):141-149.
doi: 10.1038/nmeth.4534. Epub 2017 Dec 11.

Resolving systematic errors in widely used enhancer activity assays in human cells

Affiliations

Resolving systematic errors in widely used enhancer activity assays in human cells

Felix Muerdter et al. Nat Methods. 2018 Feb.

Abstract

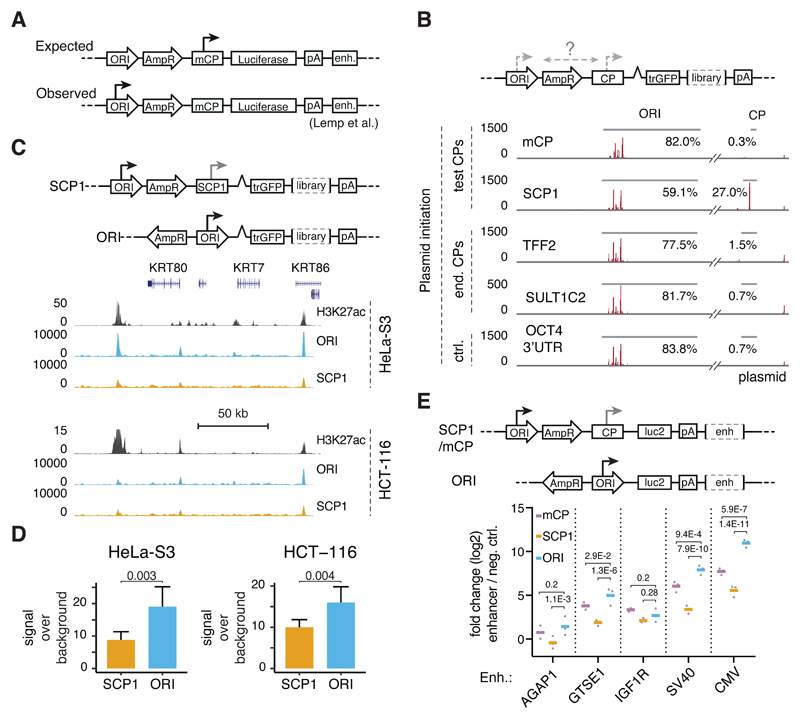
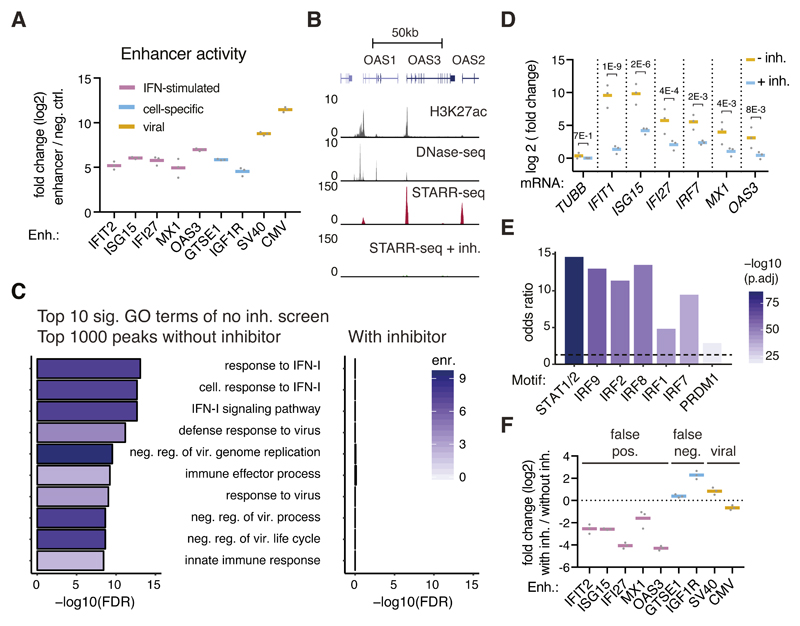
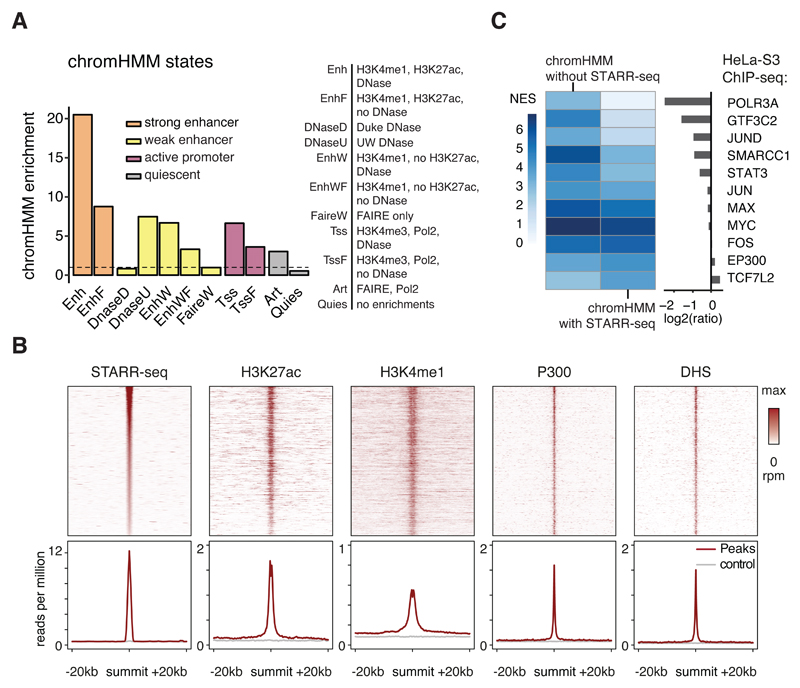
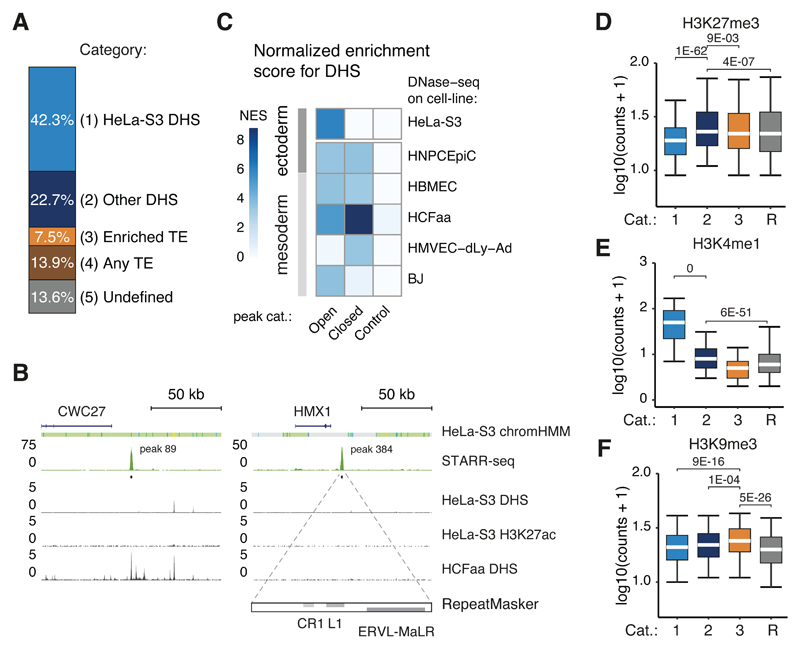
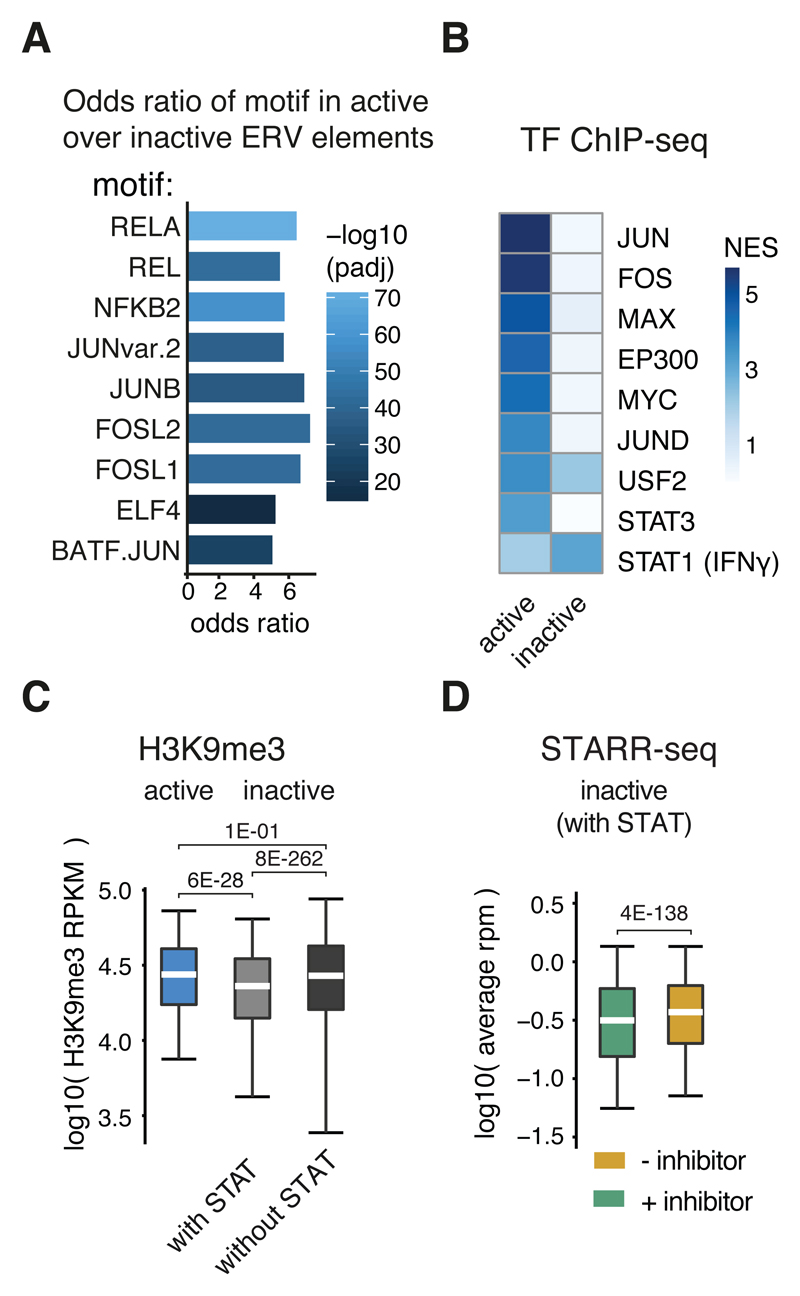
The identification of transcriptional enhancers in the human genome is a prime goal in biology. Enhancers are typically predicted via chromatin marks, yet their function is primarily assessed with plasmid-based reporter assays. Here, we show that such assays are rendered unreliable by two previously reported phenomena relating to plasmid transfection into human cells: (i) the bacterial plasmid origin of replication (ORI) functions as a conflicting core promoter and (ii) a type I interferon (IFN-I) response is activated. These cause confounding false positives and negatives in luciferase assays and STARR-seq screens. We overcome both problems by employing the ORI as core promoter and by inhibiting two IFN-I-inducing kinases, enabling genome-wide STARR-seq screens in human cells. In HeLa-S3 cells, we uncover strong enhancers, IFN-I-induced enhancers, and enhancers endogenously silenced at the chromatin level. Our findings apply to all episomal enhancer activity assays in mammalian cells and are key to the characterization of human enhancers.


Conflict of interest statement

Competing Financial Interests Statement

The authors declare no competing financial interests.

Figures

Figure 1
Figure 1. The ORI is an optimal core-promoter for STARR-seq and luciferase assays
A, Typical layout of a reporter plasmid for enhancer-activity assays (e.g. pGL3/4) with the origin-of-replication (ORI), a resistance gene (AmpR), a minimal core-promoter (mCP), a reporter gene (Luciferase), a polyadenylation sequence (polyA) and an enhancer candidate (enh.). The major site of reporter-transcript initiation is indicated with an arrow (expected vs. observed according to Lemp et al.3). B, Reporter-transcript initiation on STARR-seq plasmids as measured by STAP-seq for setups with two synthetic core-promoters (mCP, SCP1) and two endogenous core-promoters (TTF2, SULT1C2) vs. a negative control (ctrl., OCT4 3’UTR). Red vertical lines indicate transcription initiation sites with the respective initiation frequencies according to STAP-seq. The percentages indicate the fraction of all initiation events in either the ORI or the respective core-promoter. C, Original and new setup of the STARR-seq plasmid (top) and STARR-seq profiles for screens using both setups in HeLa-S3 and HCT-116 cells (H3K27ac data from ENCODE and Rickels et al., see Supplementary Table 3) at a representative locus. D, STARR-seq signal-over-background between screens employing SCP1 or the ORI as a core-promoter over predicted enhancers for HeLa-S3 cells (n=39) or HCT-116 cells (n=27). Bars represent mean signal, error bars 75% confidence intervals, P-values as listed (two-sided paired t-test). See Supplementary Figure 1E,F,G for an equivalent analysis over luciferase validated regions in HeLa-S3 cells. E, Original and new setup of the luciferase plasmids (top) and average luciferase activity (bottom) for 3 cellular (AGAP1, GTSE1, IGF1R) and 2 viral (SV40, CMV) enhancers over a negative control (in log2 fold-change) in different reporter plasmid setups with the mCP (magenta), SCP1 (orange), and ORI (blue) as core-promoter. Bars represent mean signal across three independent transfections (grey dots), P-values as listed (two-sided Fisher’s LSD test).
Figure 2
Figure 2. Genome-wide enhancer screens are dominated by false-positive signals
A, Mean enhancer activity (luciferase mRNA levels relative to negative control; log2) across three independent transfections (grey dots), assessed by qPCR in reporter assays employing the indicated enhancers. B, Representative STARR-seq enhancer activity profiles over a canonical ISG locus (GRCh37 Refseq genes indicated above) for genome-wide HeLa-S3 STARR-seq screens without and with inhibitors against TBK1/IKK/PKR (H3K27ac and DHS data from ENCODE, Supplementary Table 3). C, The 10 most significantly enriched GO terms for genes proximal to the top 1000 peaks in a HeLa-S3 STARR-seq screen. Shown are log10 transformed FDR-adjusted P-values (Fisher’s exact test) and fold-enrichments (shades of purple). The same terms were assessed for the TSSs proximal to the top 1000 peaks from the TBK1/IKK/PKR-inhibitor-treated screen. D, qPCR-based assessment of ISG-mRNA induction after DNA transfection in TBK1/IKK/PKR-inhibitor-treated vs. non-treated HeLa-S3 cells. Bars represent mean fold change across three independent transfections (grey dots), P-values as stated (two-sided Fisher’s LSD test). E, Odds ratios (FDR-adjusted P-values < 10-5, Fisher’s exact test) of indicated transcription factor motifs in STARR-seq enhancers 5-fold downregulated upon TBK1/IKK/PKR-treatment (FDR-adjusted P-value < 0.001, n=400) vs. unchanged enhancers (within +/- 1.5-fold change upon treatment, n=2245). F, Mean luciferase activity fold change across three independent transfections (grey dots) of luciferase mRNA expression in reporter assays employing the indicated enhancers in cells treated without PKR/TBK1 inhibitors over with inhibitors (log2).
Figure 3
Figure 3. STARR-seq enhancers are enriched in chromHMM enhancer-related states
A, Enrichment of enhancer relevant ChromHMM states within STARR-seq enhancers (dotted line indicates no enrichment (=1)). B, Coverage heatmaps (top) and average coverage (bottom) of STARR-seq, H3K27ac, H3K4me1, P300 and DHS signal for STARR-seq enhancers accessible in HeLa-S3 cells (rpm: reads per million; grey: random control regions). C, Normalized enrichment scores for different HeLa-S3 ChIP-seq datasets (NES, i-cisTarget26) for chromHMM strong enhancers (‘Enh’) with or without STARR-seq support and the respective fold-differences (right, log2).
Figure 4
Figure 4. STARR-seq identifies enhancers silenced endogenously
A, Percentages of STARR-seq enhancers that have significant DNase-seq signal in HeLa-S3 cells (P-value < 0.05, one-tailed binomial test), are accessible in other enriched cell types, contain repetitive elements from three enriched repeat families (see Figure 5G), contain other repetitive elements, or none of the above (undefined). B, Enhancer activity profiles over two gene loci (indicated above; DHS and H3K27ac data from ENCODE, Supplementary Table 3), representative of category 2 (CWC27, left panel) and 3 (HMX1, right panel). The right panel includes the RepeatMasker track, displaying elements of the indicated repeat families within the STARR-seq peak above. C, Normalized enrichment scores (NES, i-cisTarget26) for ENCODE DNase-seq datasets within STARR-seq enhancers that are open or closed in HeLa-S3 cells (P-value < 0.05, one-tailed binomial test). NES scores for random regions are shown as control. D, E, F, Boxplots of H3K27me3 (D), H3K4me1 (E) and H3K9me3 (F) read coverage in log10 (counts + 1) for STARR-seq enhancers of the categories defined in (A, N= 4071 (1), 2180 (2), 721 (3)) and random regions (R, N= 9613). Lower whisker: 5th percentile, lower hinge: 25th percentile, median, upper hinge: 75th percentile, upper whisker: 95th percentile. P-values as stated (one-sided Wilcoxon rank sum test).
Figure 5
Figure 5. ERV elements are co-opted for IFN-I signaling
A, Odds ratios (FDR-adjusted P-value < 0.05, two-sided Fisher’s exact test) of transcription factor motifs in active over inactive (based on STARR-seq signal) ERV elements from the three enriched ERV families (see panel G). B, i-cisTarget normalized enrichments scores for ENCODE ChIP-seq datasets within active or inactive ERV elements. C, Boxplot of H3K9me3 read coverage per kb (RPKM) in log10 over active (n=1783) or inactive ERV elements with (n=26809) or without (n=491157) STAT motifs. D, STARR-seq read coverage in log10 for STARR-seq screens with (green) or without (red) TBK1/IKK/PKR inhibition over inactive ERV elements with STAT motifs (n=26809). C,D: Lower whisker: 5th percentile, lower hinge: 25th percentile, median, upper hinge: 75th percentile, upper whisker: 95th percentile. P-values as stated (one-sided Wilcoxon rank sum test).

References

    1. Shlyueva D, Stampfel G, Stark A. Transcriptional enhancers: from properties to genome-wide predictions. Nat Rev Genet. 2014;15:272–286. - PubMed
    1. Santiago-Algarra D, Dao LTM, Pradel L, España A, Spicuglia S. Recent advances in high-throughput approaches to dissect enhancer function. F1000Res. 2017;6:939. - PMC - PubMed
    1. Lemp NA, Hiraoka K, Kasahara N, Logg CR. Cryptic transcripts from a ubiquitous plasmid origin of replication confound tests for cis-regulatory function. Nucleic Acids Res. 2012;40:7280–7290. - PMC - PubMed
    1. Zabidi MA, et al. Enhancer-core-promoter specificity separates developmental and housekeeping gene regulation. Nature. 2015;518:556–559. - PMC - PubMed
    1. Saragosti S, Moyne G, Yaniv M. Absence of nucleosomes in a fraction of SV40 chromatin between the origin of replication and the region coding for the late leader RNA. Cell. 1980;20:65–73. - PubMed

Publication types