. 2017 Dec 19:4:170193.
doi: 10.1038/sdata.2017.193.

ANI-1, A data set of 20 million calculated off-equilibrium conformations for organic molecules

Affiliations

ANI-1, A data set of 20 million calculated off-equilibrium conformations for organic molecules

Justin S Smith et al. Sci Data. .

Abstract

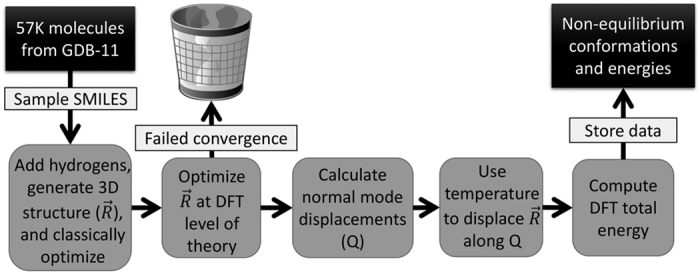
One of the grand challenges in modern theoretical chemistry is designing and implementing approximations that expedite ab initio methods without loss of accuracy. Machine learning (ML) methods are emerging as a powerful approach to constructing various forms of transferable atomistic potentials. They have been successfully applied in a variety of applications in chemistry, biology, catalysis, and solid-state physics. However, these models are heavily dependent on the quality and quantity of data used in their fitting. Fitting highly flexible ML potentials, such as neural networks, comes at a cost: a vast amount of reference data is required to properly train these models. We address this need by providing access to a large computational DFT database, which consists of more than 20 M off equilibrium conformations for 57,462 small organic molecules. We believe it will become a new standard benchmark for comparison of current and future methods in the ML potential community.


Conflict of interest statement

The authors declare no competing financial interests.

Figures

Figure 1
Figure 1. Schematic representation of data generation.
Scheme for generating non-equilibrium conformations of 57,462 molecules from the GDB-11 database. The goal with this scheme is to generate a ‘window’ of the potential surface around each optimized equilibrium structure.
Figure 2
Figure 2. Data Structure.
Description of the containers stored in the dictionary returned by iterating through molecules stored in the HDF5 file format. The ‘coordinates’ key gives access to a 3D array containing each conformer of the molecule in cartesian coordinates, while the ‘energies’ key gives the 1D array of energies for the conformers. The first dimension of each ‘coordinates’ and ‘energies’ array maps correctly to the corresponding structure. The ‘species’ key contains the atomic symbol of the atoms and is ordered to correspond to the correct atoms in the second dimension of the array returned by the ‘coordinates’ key. Other keys in the returned dictionary are: ‘coordinatesHE’, ‘energiesHE’, and ‘smiles’ for the high energy coordinates, high energy energies and SMILES string, respectively.
Figure 3
Figure 3. Dataset energy distribution.
(a) The distribution of total energies divided by the number of electrons from normal mode sampling conducted on each sub set (04 through 08) of GDB-11. Each distribution is scaled to have equal area. (b) Distribution of atomization energies from the completed data set with the inset showing a long tail reaching greater than 12 Ha. (c) Distribution of atomization energies after truncating any energies over 275 kcal×mol−1 from each molecule’s minimum energy.
Figure 4
Figure 4. Distance distribution for dataset.
Distribution of atomic distances in the subset of the data set constructed from the molecules containing between 4 and 8 heavy atoms (GDB-04 to 08) of C, N, and O. The y-axis is the base 10 logarithm of the count of distances in each bin, normalized over the full domain so that the two sets can be compared. The x-axis represents the atomic distance (r) divided by the single bond equilibrium distance (r0) for the smallest possible molecule containing a single bond of the type shown, as calculated using the ωB97x density functional with the 6–31 g(d) basis set. The red histogram shows the full distribution of distances for a data set containing only equilibrium distances. The blue line shows the distribution of our non-equilibrium data set, with distances randomly sub sampled at a rate of 1%. As the figure shows, even 1% of the non-equilibrium data set covers vast areas of atomic distance space where the equilibrium data set fails to sample.
Figure 5
Figure 5. Angular distribution.
Figure shows distributions involving the angles in the data sets, and tells a similar story in terms of coverage in conformational space for three body interactions. The blue background density plot shows that the ANI-1 data set better covers angle space than the equilibrium data sets (red and orange). The remaining figures for the angular distributions are included in the Supplementary Information.

Dataset use reported in

  • doi: 10.1039/C6SC05720A

References

Data Citations

    1. Smith J. S., Isayev O., Roitberg A. E. 2017. Figshare. https://doi.org/10.6084/m9.figshare.c.3846712 - DOI

References

    1. Becke A. D. Perspective: Fifty years of density-functional theory in chemical physics. J. Chem. Phys. 140, 18A301 (2014). - PubMed
    1. Grimme S., Antony J., Schwabe T. & Mück-Lichtenfeld C. Density functional theory with dispersion corrections for supramolecular structures, aggregates, and complexes of (bio)organic molecules. Org. Biomol. Chem. 5, 741–758 (2007). - PubMed
    1. te Velde G. et al. Chemistry with ADF. J. Comput. Chem. 22, 931–967 (2001).
    1. Brunk E. & Rothlisberger U. Mixed Quantum Mechanical/Molecular Mechanical Molecular Dynamics Simulations of Biological Systems in Ground and Electronically Excited States. Chemical Reviews 115, 6217–6263 (2015). - PubMed
    1. Norskov J. K., Abild-Pedersen F., Studt F. & Bligaard T. Density functional theory in surface chemistry and catalysis. Proc. Natl. Acad. Sci 108, 937–943 (2011). - PMC - PubMed

Publication types

LinkOut - more resources