. 2017 Dec 18;43(6):744-762.e11.
doi: 10.1016/j.devcel.2017.11.014.

Evolutionary Proteomics Uncovers Ancient Associations of Cilia with Signaling Pathways

Affiliations

Evolutionary Proteomics Uncovers Ancient Associations of Cilia with Signaling Pathways

Monika Abedin Sigg et al. Dev Cell. .

Abstract

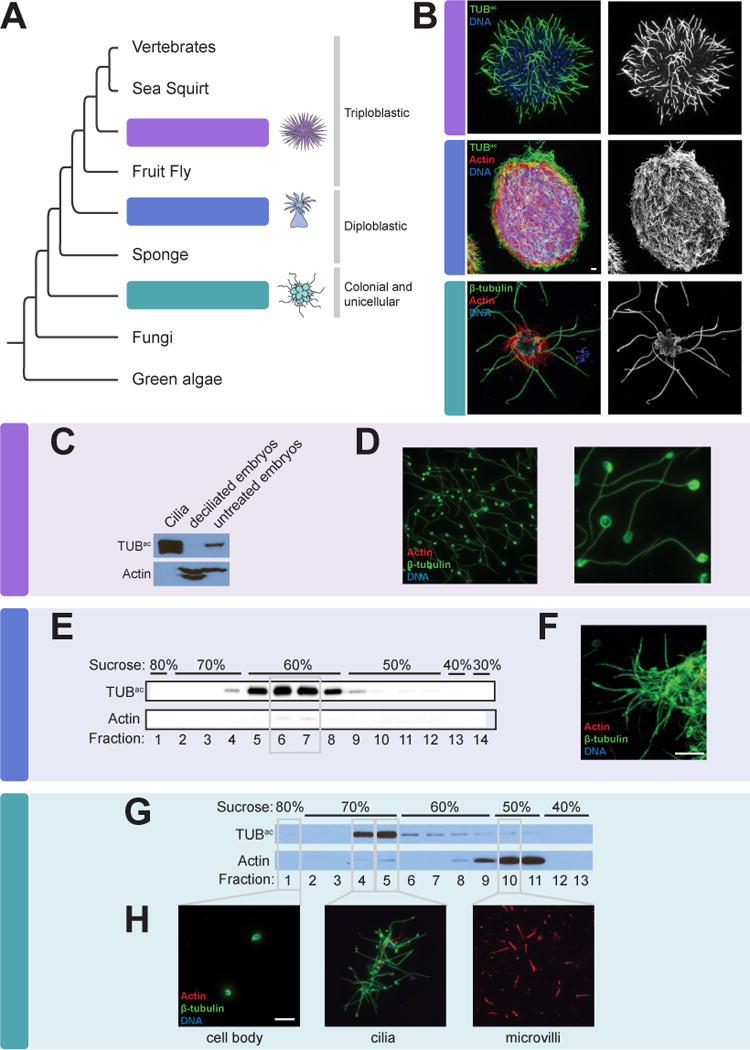
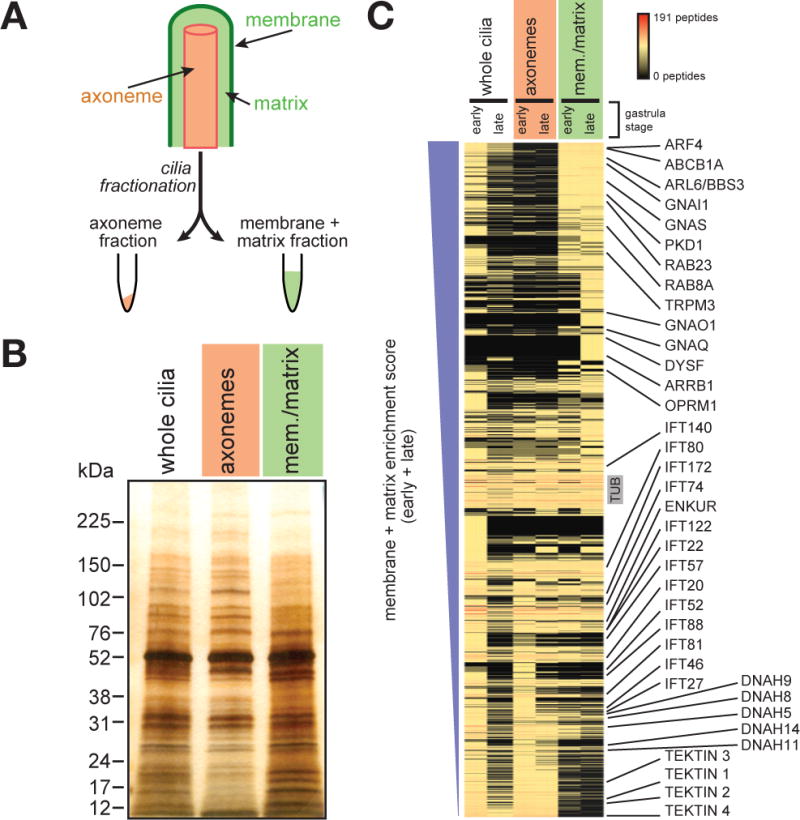
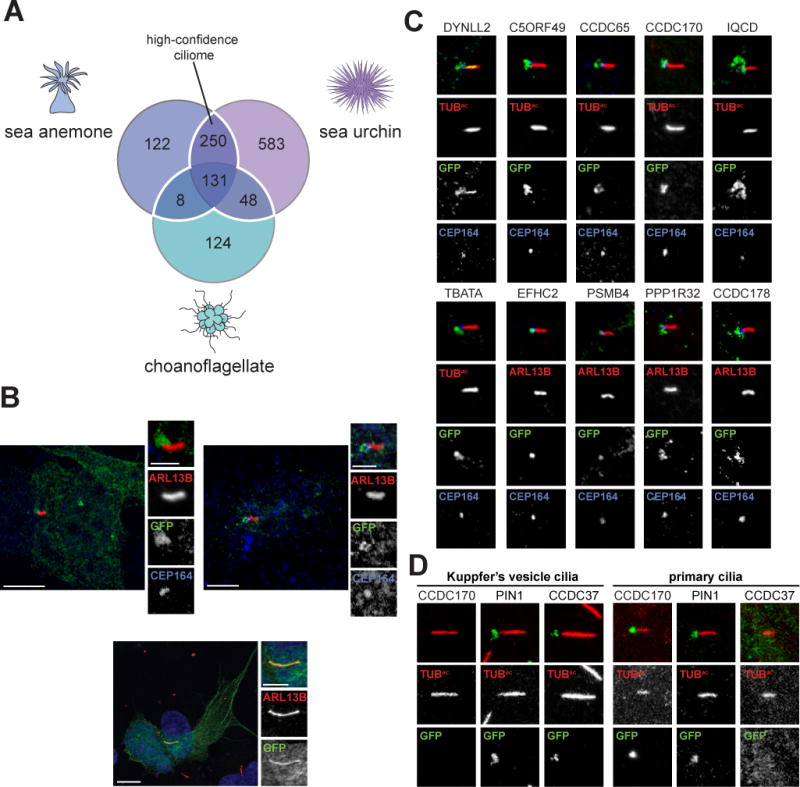
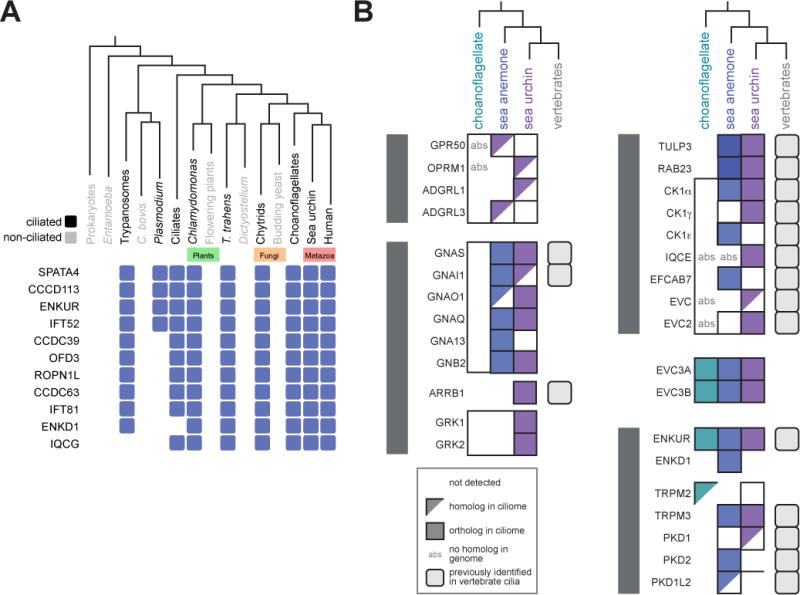
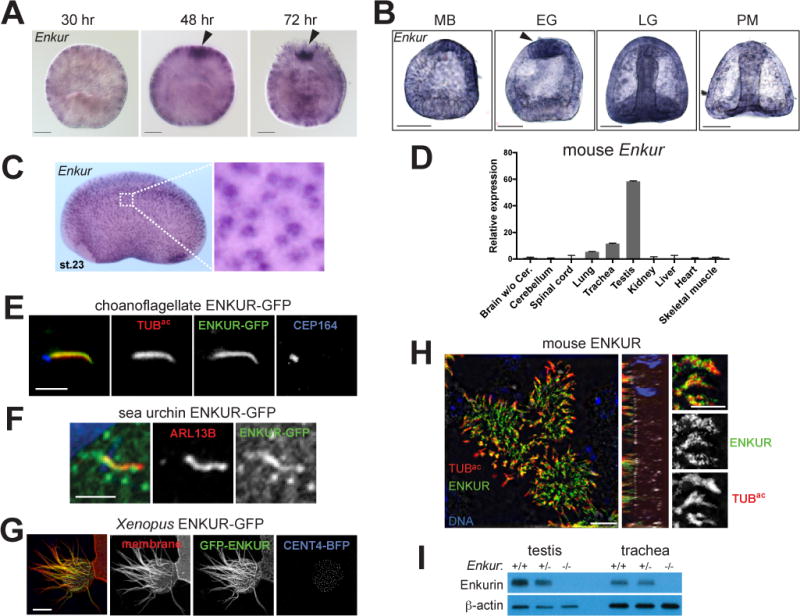
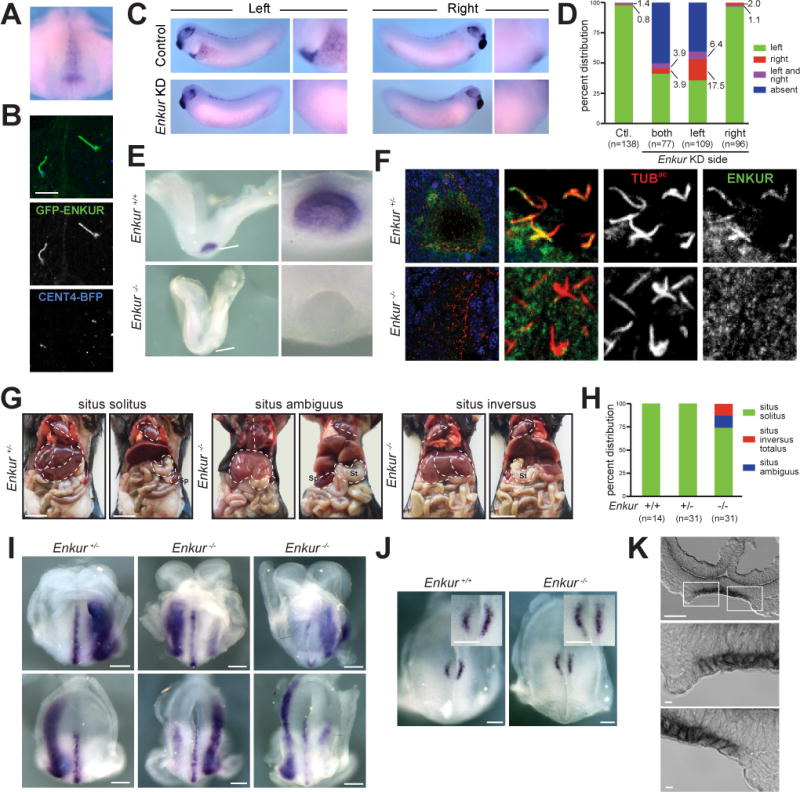
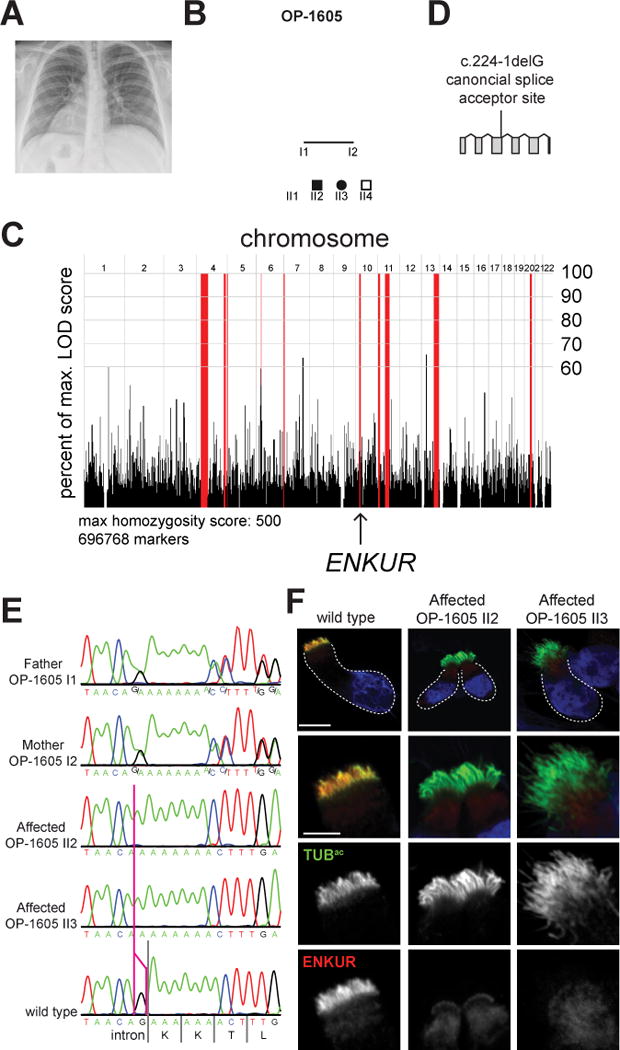
Cilia are organelles specialized for movement and signaling. To infer when during evolution signaling pathways became associated with cilia, we characterized the proteomes of cilia from sea urchins, sea anemones, and choanoflagellates. We identified 437 high-confidence ciliary candidate proteins conserved in mammals and discovered that Hedgehog and G-protein-coupled receptor pathways were linked to cilia before the origin of bilateria and transient receptor potential (TRP) channels before the origin of animals. We demonstrated that candidates not previously implicated in ciliary biology localized to cilia and further investigated ENKUR, a TRP channel-interacting protein identified in the cilia of all three organisms. ENKUR localizes to motile cilia and is required for patterning the left-right axis in vertebrates. Moreover, mutation of ENKUR causes situs inversus in humans. Thus, proteomic profiling of cilia from diverse eukaryotes defines a conserved ciliary proteome, reveals ancient connections to signaling, and uncovers a ciliary protein that underlies development and human disease.

Keywords: GPCR; Hedgehog signaling; TRP channel; choanoflagellate; ciliopathy; cilium; left-right axis patterning; proteomics; sea anemone; sea urchin.


Figures

Figure 1
Figure 1. Isolation of cilia from sea urchins, sea anemones and choanoflagellates
(A) The phylogenetic relationship of the organisms studied in this work to other eukaryotes. (B) Immunofluorescent staining of cilia, marked by β-tubulin or Tubulinac (TUBac) (green), in a sea urchin (Strongylocentrotus purpuratus) gastrula embryo, a sea anemone (Nematostella vectensis) planula larva, and a colony of choanoflagellate cells (Salpingoeca rosetta). Phalloidin staining of the sea anemone larva demonstrates the localization of Actin (red) to the cell bodies. Phalloidin staining of the choanoflagellate colony marks the collar of microvilli that surrounds each flagellum. Nuclei are stained with DAPI (blue). (C) Lysates of isolated S. purpuratus embryonic cilia, deciliated embryos, and intact embryos immunoblotted for TUBac and Actin. Cilia are enriched for TUBac and have undetectable amounts of Actin, whereas deciliated embryos have undetectable amounts of TUBac. (D) Immunostaining of purified S. purpuratus cilia for β-tubulin (green), Actin (red) and nuclei (DAPI, blue) demonstrates that the axonemes of isolated cilia remain intact (β-tubulin) and confirms that no Actin or nuclei are detected in the ciliary fraction. (E) Immunoblot analysis of fractions from the sucrose step gradient purification of isolated N. vectensis cilia reveals that the 60% sucrose fractions contains TUBac, peaking in fractions 6 and 7. (F) Immunostaining of fraction 7 for β-tubulin (green), Actin (red) and nuclei (DAPI, blue) confirms that the sea anemone ciliary fraction is replete with cilia (TUBac) and contains little Actin and no detectable nuclei. (G) Immunoblot analysis of fractions from the sucrose step gradient purification of S. rosetta components reveal that TUBac is enriched in the 70% sucrose step and Actin is enriched in the 50% sucrose step. (H) Immunostaining of fractions for β-tubulin (green), Actin (red) and nuclei (DAPI, blue) confirms that cilia are enriched in the 70% sucrose step, cell bodies identified by DAPI staining are in the 80% sucrose step and microvilli marked by Actin are enriched in the 50% sucrose step. Scale bars, 5 μm for all images. (See Table S1).
Figure 2
Figure 2. Characterization of the sea urchin ciliome
(A) A schematic of ciliary fractionation. Treatment of whole isolated S. purpuratus cilia with detergent followed by centrifugation separates cilia into two fractions, axonemes and membrane + matrix. (B) Silver stain of isolated S. purpuratus whole cilia, axonemes and membrane + matrix (mem./matrix) fractions resolved by SDS-PAGE. The protein banding pattern of the axoneme fraction differs from that of the membrane + matrix fraction. (C) Proteins sorted by their membrane + matrix enrichment score (see Methods). The unique peptide count for each protein is represented in the heat map. Known axonemal proteins (e.g., IFT components, axonemal Dyneins and Tektins) are enriched in the axonemal fraction. Known ciliary membrane and membrane-associated proteins (e.g., PKD1, ARF4, RAB8A) are enriched in the membrane + matrix fraction. (See Table S2).
Figure 3
Figure 3. Defining an evolutionarily conserved ciliome
(A) Venn diagram of the overlap of S. purpuratus, N. vectensis and S. rosetta ciliomes. The white line encompasses the high-confidence ciliary proteins present in 2 or more ciliomes. Only proteins that possess a mouse homolog (BLAST E value ≤ 1e-5) are included. (B) Immunofluorescent staining for cilia (ARL13B, red) and candidate proteins fused to GFP (green) expressed in IMCD3 cells. Human C4orf47-GFP localizes to cilia and cytoplasmic microtubules. Fusions of human CSNK1D and CCDC113 with GFP predominantly co-localize with the basal body component CEP164 (blue). For C4orf46-GFP, nuclei are stained with Hoechst (blue). Scale bar for whole cell images, 5 μm. Scale bar for cilia only images, 2.5 μm. (C) Ten GFP-tagged human proteins, out of 49 randomly selected proteins from the high-confidence ciliome, localize to cilia or the ciliary base of IMCD3 cells. Immunofluorescent staining marks GFP-tagged proteins (green), cilia are indicated by ARL13B or TUBac (red), as indicated, and the basal body is highlighted by CEP164 (blue). Scale bar, 2.5 μm. (D) Immunofluorescent staining of human proteins fused to GFP (green) in the D. rerio embryo (somite stage 6–10). Cilia are marked by staining for TUBac (red). Cilia from within the Kuppfer’s vesicle and primary cilia found outside the Kuppfer’s vesicle are depicted. Scale bar, 2.5 μm. (See also Figure S1, S3, Table S3, S4 and S5).
Figure 4
Figure 4. The distribution of signal transduction components detected in ciliomes
(A) Select ciliome proteins display a phylogenetic profile closely reflecting the distribution of cilia as based on CLIME analysis. Ciliated organisms are shown in black and non-ciliated organisms are shown in grey. A blue box indicates that a homolog is present in the organism or group of organisms represented in the phylogeny. For the complete list of ciliome proteins with distributions overlapping with ciliation within a phylogeny of 136 organisms, see Figure S2. For clades represented by more than one organism (i.e. Choanoflagellates, Budding yeast, Chytrids, Flowering plants, Ciliates, Plasmodium, Trypanosomes, Entamoeba and Prokaryotes) a protein was considered to be present in the clade if one or more organisms possessed the protein. (B) The ciliome of each organism contains diverse signal transduction components, most of which have homologs in vertebrates and some of which have not been previously associated with cilia. Proteins were considered orthologs if they were reciprocal best BLAST hits. The top BLAST hit in M. musculus was considered a homolog of the S. purpuratus, N. vectensis and S. rosetta query protein if the two proteins were not reciprocal BLAST matches (E value ≤ 1e-5). (See also Figure S2 and Table S6).
Figure 5
Figure 5. ENKUR is a conserved ciliary protein expressed by cells with motile cilia
(A) Whole mount in situ hybridization for Enkur in N. vectensis embryos at various developmental stages. Enkur is expressed throughout the embryo and is enriched at the aboral pole (arrowhead) in 48 and 74 hour embryos. Scale bar, 50 μm. (B) In situ hybridization for Enkur in S. purpuratus embryos at mesenchyme blastula (MB), early gastrula (EG), late gastrula (LG) and prism (PM) stages. Scale bar, 50 μm. Enkur is expressed in all cells and enriched at the apical pole in EG embryos. (C) In situ hybridization of stage 23 X. laveis embryo shows expression of Enkur in epidermal cells. (D) qRT-PCR measurement of Enkur expression in isolated adult mouse lungs, trachea and testis. Error bars represent SDs from 6 technical replicates. Expression was validated using 2 distinct primer pairs. (E) Immunofluorescent staining of S. rosetta ENKUR fused to GFP (green), cilia (TUBac, red) and the basal body (CEP164, blue) expressed in IMCD3 cells. Scale bar, 2.5 μm. (F) Immunofluorescent staining of cilia (ARL13B, red) and a fusion of S. purpuratus ENKUR with GFP (green) expressed in RPE-1 cells. ENKUR-GFP localizes to cilia. Nuclei are stained with Hoechst (blue). Scale bar, 2.5 μm. (G) A multi-ciliated epidermal cell of a stage 23 X. laevis embryo expressing X. laevis ENKUR fused to GFP (green), membrane-red fluorescent protein (red), marking the plasma and ciliary membranes, and Centrin 4 (CENT4)-blue fluorescent protein (BFP, blue) to mark the basal bodies. ENKUR localizes along the length of cilia. Scale bar, 10 μm. (H) Immunofluorescent staining of primary cultured mouse tracheal epithelial cells for ENKUR (green), cilia (TUBac, red), and the basal body (CEP164, white), and imaged using structured illumination microscopy. ENKUR localizes to mouse tracheal epithelial cilia. Scale bar for whole cells (top and center panels), 5 μm. Scale bar for cilia (bottom panel), 2.5 μm. (I) Immunoblotting for ENKUR protein in testis and trachea lysates from littermate control and Enkur−/− mice. ENKUR is expressed in testis and trachea, whereas Enkur−/− mice do not produce detectable ENKUR. (See also Figure S4 and S5).
Figure 6
Figure 6. ENKUR is required for left-right axis patterning in mice
(A) Whole mount in situ hybridization of a stage 17 X. laevis embryo for Enkur. Ventral view of dorsal resection of embryo. Only the posterior region of the embryo is shown. Enkur is expressed in the gastrocoel roof plate (GRP). (B) Fluorescence imaging of X. laevis GRP cilia expressing GFP-ENKUR (green) and CENT4-BFP (blue). CENT4-BFP marks basal bodies. Scale bar, 5 μm. (C) In situ hybridization for Pitx2c of a stage 28 X. laevis control embryo and an Enkur knockdown (KD) embryo. Pitx2c is expressed in the left lateral plate (arrowhead and high magnification image) of control embryos but is absent in the Enkur KD embryo. (D) Quantification of Pitx2c expression patterns in control and Enkur KD embryos. (E) In situ hybridization of 2–4 somite stage littermate control and Enkur−/− mouse embryos for Enkur. At this stage, Enkur is expressed exclusively in the node. Enkur−/− embryos do not express detectable Enkur. Scale bar for left panel, 50μm. Scale bar for right panel, 25 μm. (F) Immunofluorescence staining of 2–4 somite stage mouse embryos for ENKUR (green) and cilia (TUBac, red). ENKUR localizes to the cilia of the node and is not detectable in the cilia of Enkur−/− nodes. Nuclei are stained with Hoechst (blue). Scale bar for left panels, 10 μm. Scale bar for right 6 panels, 2.5 μm. (G) Photographs of thoracic and abdominal organ positions. The right (R) and left (L) side of the body are indicated. Some Enkur−/− mice display situs ambiguus, illustrated here by abnormal heart apex orientation, midline liver and right-sided spleen. Some Enkur−/− mice display situs inversus, a complete reversal of the left-right axis. Scale bar, 1 cm. (H) Quantification of situs in littermate control and Enkur−/− mice. (I) In situ hybridization of 3–5 somite stage littermate control and Enkur−/− embryos for Lefty2. Upper panels are rostral views. Lower panels are caudal views. The right (R) and left (L) side of the embryo are indicated. Control embryos exhibit Lefty2 expression in the midline and left lateral plate mesoderm. Enkur−/− embryos exhibit variable patterns of Lefty2 expression, including expression predominantly in the right lateral plate mesoderm (middle) or partially in the right lateral plate mesoderm (right). Scale bar, 50 μm. (J) In situ hybridization of 3–5 somite stage littermate control and Enkur−/− embryos for Cerl2. The right (R) and left (L) side of the embryo are indicated. Control embryos display an enrichment of Cerl2 expression on the right side of the node. Enkur−/− embryos express equal levels of Cerl2 on both sides of the node. Scale bar, 100 μm. (K) Cryosectioned in situ hybridization of 2–4 somite stage mouse embryo for Enkur. Top panel depicts the entire node and lower two panels depict areas indicated by white boxes. Enkur is expressed predominantly within the pit cells (pc) and not the crown cells (cc) of the node. Scale bar top panel, 50 μm. Scale bar bottom two panels, 5 μm. (See also Figure S5 and Movie S2).
Figure 7
Figure 7. An inherited human ENKUR mutation causes situs inversus
(A) A chest X-ray of OP-1605 II3. The heart is indicated with an “H”, revealing dextrocardia. The right (R) and left (L) side of the body are indicated. (B) Pedigree of family OP-1605. Third degree consanguineous individuals are the parents of 2 siblings, individuals II2 and II3, affected with situs inversus. (C) Homozygosity mapping of the mother (OP-1605 I2) and one affected individual (OP 1605-II3) identified a short homozygous region on chromosome 10 containing ENKUR. (D) Schematic of the human ENKUR gene. The identified 1 bp deletion, c.224-1delG, occurs in the splice acceptor of the second intron. (E) Sanger sequence chromatograms of the ENKUR intron-exon boundary of the two affected individuals, their parents and an unrelated wild type individual. The pink line identifies the position of the last nucleotide of ENKUR intron 2 affected by the deletion. Both affected individuals are homozygous for c.2241-delG. Both parents are heterozygous for the mutation. (F) Immunofluorescence imaging of nasal epithelial cells from an unaffected control and two affected individuals for ENKUR (red) and cilia (TUBac, green). Nuclei are stained with DAPI (blue). ENKUR localizes to cilia of control cells, and is missing from the cilia of affected individuals. The dotted line highlights the cell border. Scale bar for whole cells (top panel), 10 μm. Scale bar for cilia (bottom 3 panels), 5 μm. (See also Figure S5, S6, S7, Table S7, S8 and Movie S1).

Comment in

References

    1. Abecasis GR, Cherny SS, Cookson WOC, Cardon LR. GRR: graphical representation of relationship errors. Bioinformatics. 2001a;17:742–743. - PubMed
    1. Abecasis GAR, Cherny SS, Cookson WO, Cardon LR. Merlin: rapid analysis of dense genetic maps using sparse gene flow trees. Nat Genet. 2001b;30:97–101. - PubMed
    1. Adamska M, Matus DQ, Adamski M, Green K, Rokhsar DS, Martindale MQ, Degnan BM. The evolutionary origin of hedgehog proteins. Curr Biol. 2007;17:R836–R837. - PubMed
    1. Afzelius BA. A human syndrome caused by immotile cilia. Science. 1976;193:317–319. - PubMed
    1. American Thoracic Society and European Respiratory Society. ATS/ERS Recommendations for Standardized Procedures for the Online and Offline Measurement of Exhaled Lower Respiratory Nitric Oxide and Nasal Nitric Oxide, 2005. Am J Respir Crit Care Med. 2005;171:912–930. - PubMed

Publication types

MeSH terms

Substances