. 2018 Jan 4;553(7686):73-76.
doi: 10.1038/nature25138. Epub 2017 Dec 20.

Unexpectedly large impact of forest management and grazing on global vegetation biomass

Affiliations

Unexpectedly large impact of forest management and grazing on global vegetation biomass

Karl-Heinz Erb et al. Nature. .

Abstract

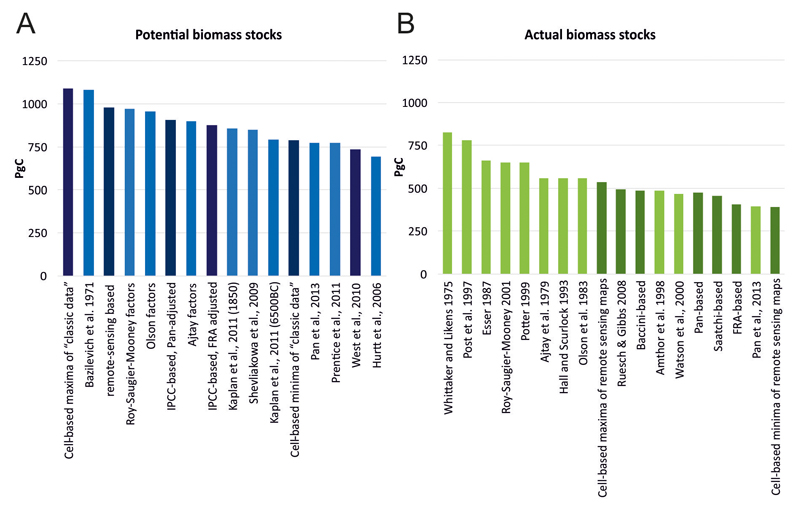
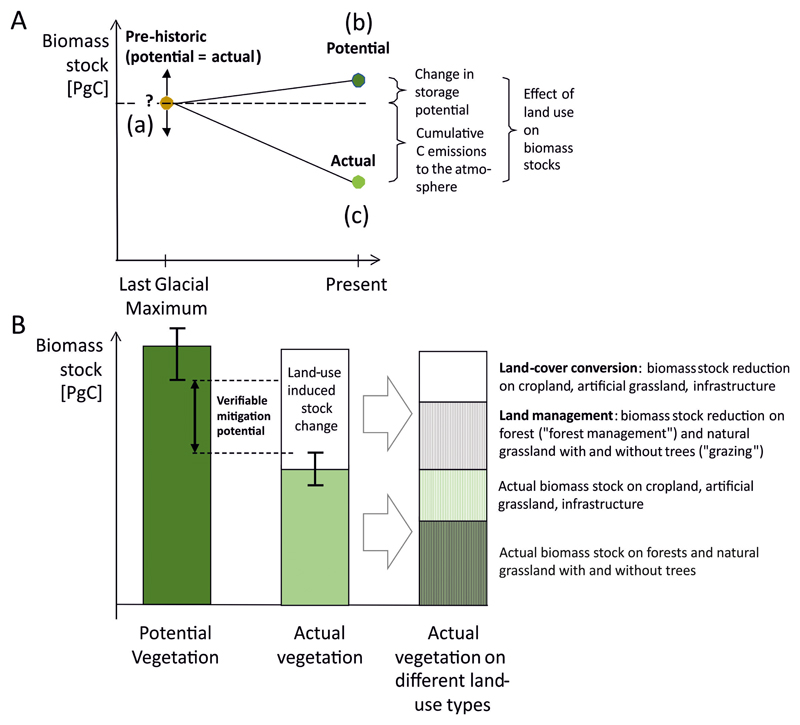
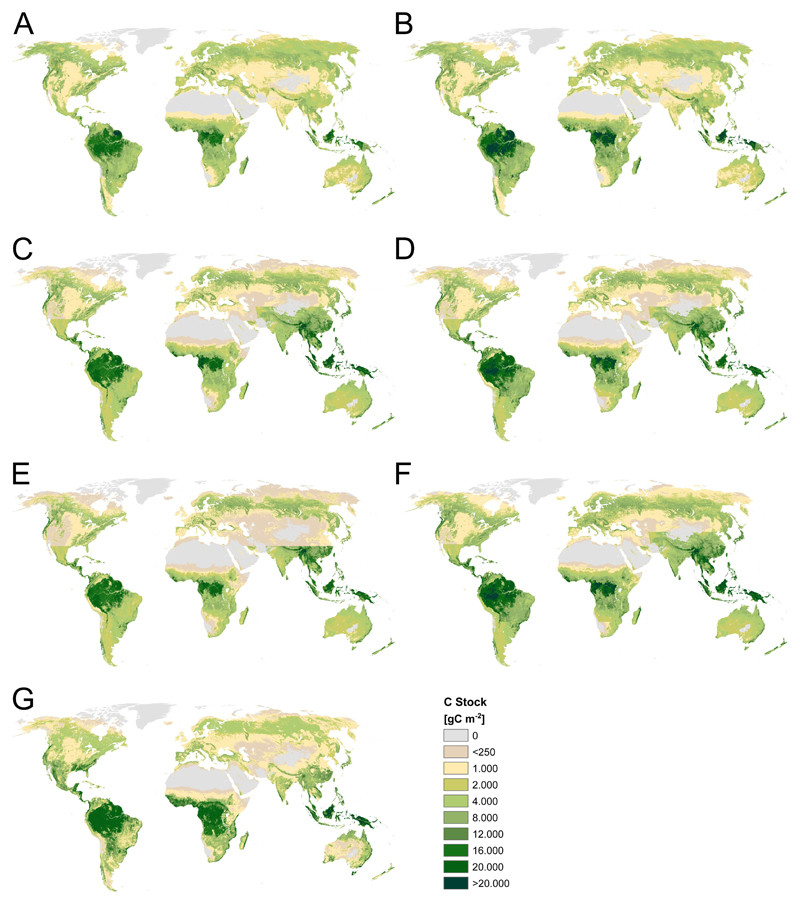
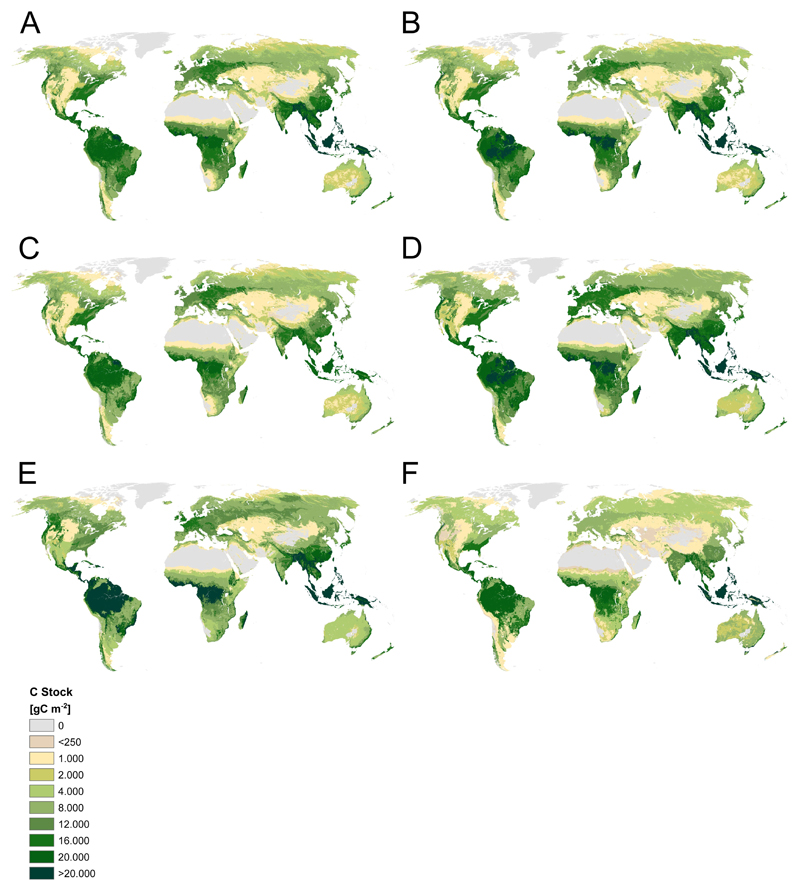
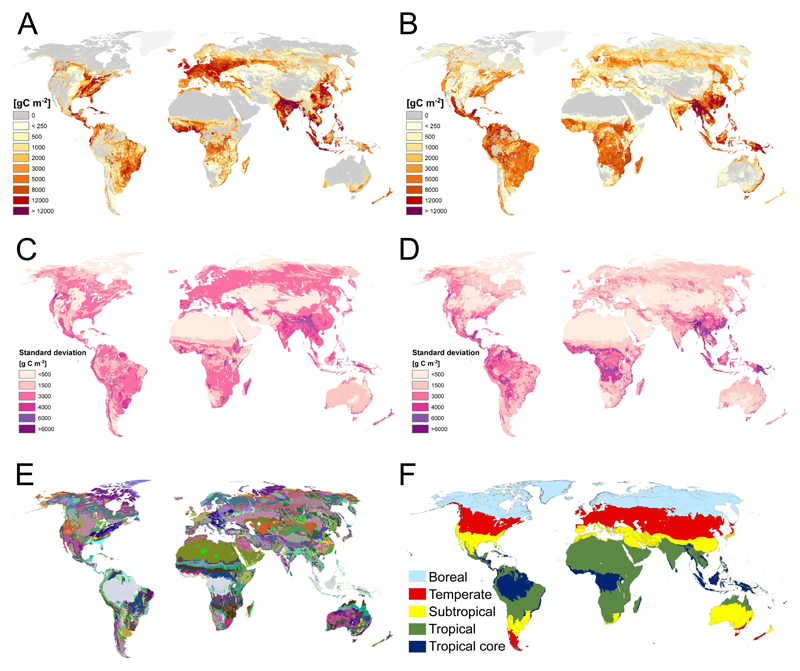
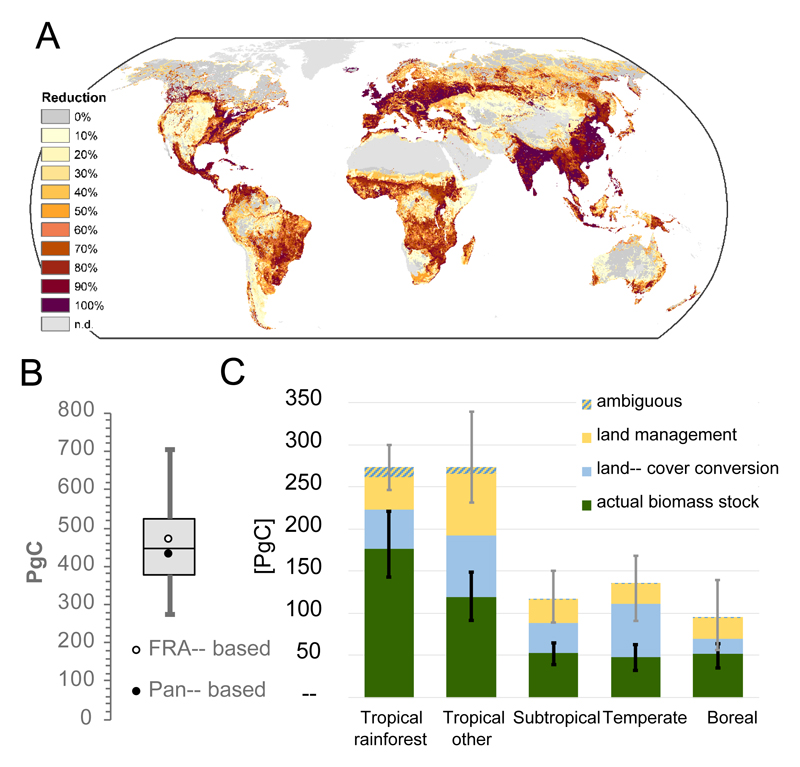
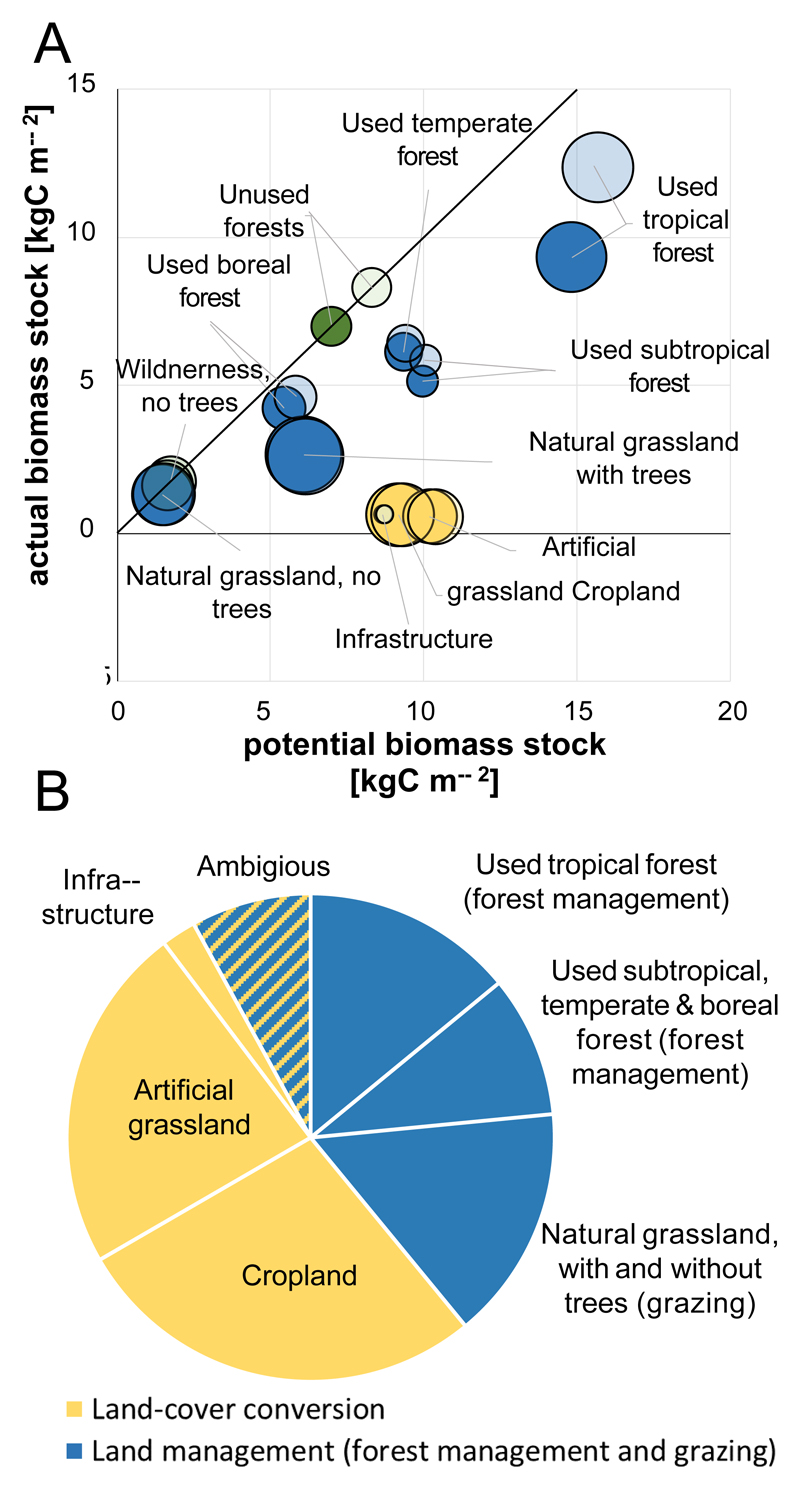
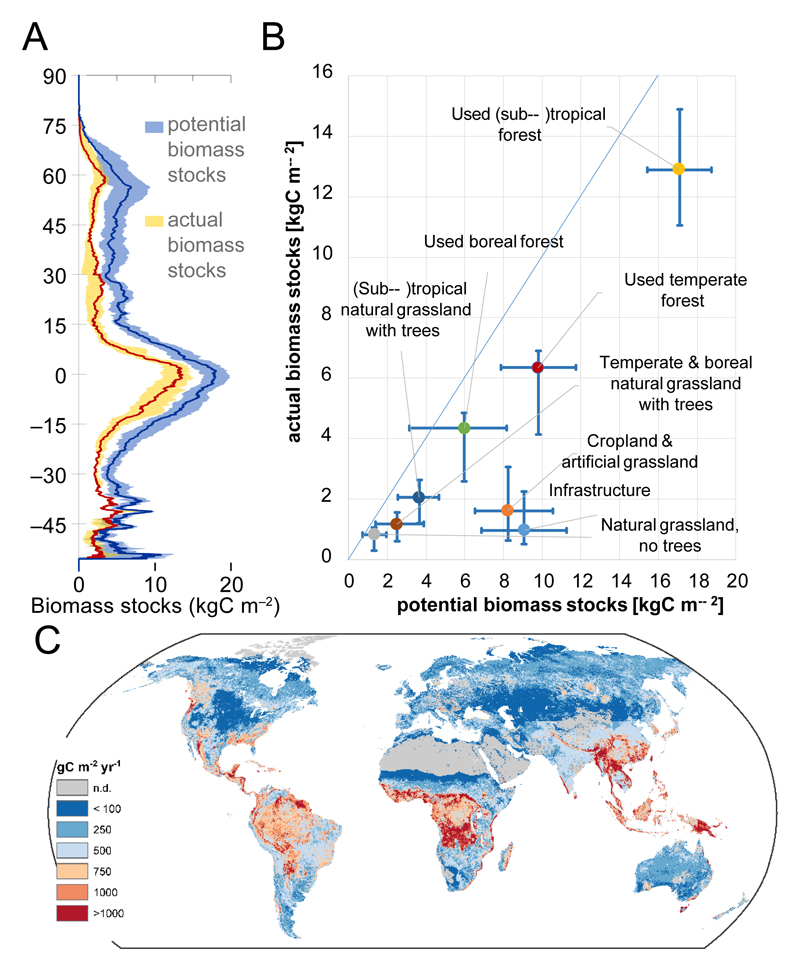
Carbon stocks in vegetation have a key role in the climate system. However, the magnitude, patterns and uncertainties of carbon stocks and the effect of land use on the stocks remain poorly quantified. Here we show, using state-of-the-art datasets, that vegetation currently stores around 450 petagrams of carbon. In the hypothetical absence of land use, potential vegetation would store around 916 petagrams of carbon, under current climate conditions. This difference highlights the massive effect of land use on biomass stocks. Deforestation and other land-cover changes are responsible for 53-58% of the difference between current and potential biomass stocks. Land management effects (the biomass stock changes induced by land use within the same land cover) contribute 42-47%, but have been underestimated in the literature. Therefore, avoiding deforestation is necessary but not sufficient for mitigation of climate change. Our results imply that trade-offs exist between conserving carbon stocks on managed land and raising the contribution of biomass to raw material and energy supply for the mitigation of climate change. Efforts to raise biomass stocks are currently verifiable only in temperate forests, where their potential is limited. By contrast, large uncertainties hinder verification in the tropical forest, where the largest potential is located, pointing to challenges for the upcoming stocktaking exercises under the Paris agreement.


Conflict of interest statement

The authors declare no competing financial interest.

Figures

Extended Data Figure 1
Extended Data Figure 1. Estimates on potential (A) and actual (B) biomass stocks from the literature and this study.
Sources: Bazilevich et al., 1971, Pan et al., 2013, Prentice et al., 2011, West et al., 2010, Hurtt et al., 2011, Whittaker and Likens, 1975, Post et al., 1997, Esser, 1987, Roy-Saugier-Mooney, 2001, Potter, 1999, Ajtay et al., 1979, Hall and Scurlock, 1993, Olson et al., 1983, Ruesch & Gibbs, 2008, Amthor et al., 1998, Watson et al., 2000. The darker shaded columns are those used in this study (for details see text).
Extended Data Figure 2
Extended Data Figure 2. Conceptual and methodological design of the study.
A The relation of prehistoric (a), potential (b) and actual (c) biomass stocks. Potential vegetation refers to the vegetation that would prevail in the absence of land use but with current environmental conditions. As both actual and potential vegetation refer to the same environmental conditions, their difference must not be interpreted as a stock change between two points in time. In consequence, the comparison of potential and actual biomass stocks does not refer to the cumulative net balance of all fluxes from and to the biomass compartment (e.g. induced by land use and environmental changes). Rather, it isolates and quantifies the effect of land use on biomass stocks. The effect of land use is comprised of two components, i.e. cumulative land-use emissions and land-use induced reductions in carbon sequestration that would result from environmental changes. For more information and discussion, see Supporting Information. B. Conceptual attribution of the difference between potential and actual biomass stocks to land conversion and land management. Error bars reflect the divergence among datasets for the respective vegetation types and indicate the determination of verification volumes.
Extended Data Figure 3
Extended Data Figure 3. Actual biomass stock maps used in the study.
Unproductive areas have been clipped from all maps. A) FRA-based, B) Pan-based, C) Saatchi-based, D) Baccini-based, E) Remote-sensing derived minimum, F) Remote sensing derived maximum, G) Ruesch & Gibbs 2008. For details and sources for maps A-F, see Method section.
Extended Data Figure 4
Extended Data Figure 4. Potential biomass stock maps used in the study.
Unproductive areas have been clipped from all maps. A) IPCC-based, FRA adjusted, B) IPCC-based, Pan-adjusted, C) Cell-based minima of “classic data”, D) Cell-based maxima of “classic data”, E) Remote sensing derived, F) West et al. 2010. For details and sources for maps A-E, see Method section.
Extended Data Figure 5
Extended Data Figure 5. Land-use induced difference in potential and actual biomass stocks, uncertainty of input data and vegetation units used in the study.
A) Impact of land-cover conversion, B) impact of land management. A) and B) maps are based on the FRA-based actual biomass stock map and the corresponding, IPCC-based FRA-adjusted potential carbon stock map. C) Standard deviation of potential biomass stocks maps (n=6), D) Standard deviation of actual biomass stock maps (n=7). E) Intersect of all three– biome maps used in the ecozone approaches and for the construction of the RS-based potential biomass stock map. F) FAO Ecozones used for the aggregation of results. The “tropical core” consists of humid rainforests. The tropical zones contains moist deciduous forests, dry forests, and tropical shrubs.
Fig. 1
Fig. 1. Differences in biomass stocks of the potential and actual vegetation induced by land use.
A. Spatial pattern of land-use induced biomass stock differences (expressed in percent of potential biomass stocks), mean of all 42 estimates; B. Box plot of all 42 estimates. Whiskers indicate the range, the box the inner 50% percentiles, the line the median of all estimates; the two dots represent the results of the two approaches used for the attribution of biomass stock differences to land-cover conversion and land management. C. Actual and potential biomass stocks in the world’s major biomes (see Extended Data Figure 5f), and role of land-cover conversion and management in explaining their difference. Whiskers indicate the range of the estimates for potential (grey; n=6) and actual (black; n=7) biomass stocks.
Fig. 2
Fig. 2. Contribution of land-use types to the difference between potential and actual biomass stocks.
A. Potential and actual biomass stock per unit area per land-use type for the FRA-based (dark colors) and the Pan-based assessment (light colors). Circle size is proportional to the global extent of the individual land-uses. The diagonal line indicates the 1:1 relationship between actual and potential biomass stocks (no change, green color). B. Relative contribution of land-cover conversion and land management to the difference between potential and actual biomass stocks, based on the FRA-based and Pan-based assessments. “Ambiguous” denotes cases attributed differently in the two assessments (for absolute values refer to Extended Data Table 1).
Fig. 3
Fig. 3. Uncertainty of biomass stock estimates.
A. Latitudinal profile of all seven actual (yellow) and all six potential (blue) biomass stock estimates, the lines indicate the respective median, shaded areas the envelope (range). B. Ranges of potential and actual biomass stocks per land-use type, intersected at the median (n=6 for potential, n=7 for actual biomass stocks). In the absence of consistent land-use information for all layers, biomass stock changes were estimated on grid cells dominated (>85%) by a land-use type and thus slightly deviate from estimates displayed in Fig.2. The diagonal line indicates the 1:1 relationship where actual and potential biomass stocks are equal. C. Detection limit of annual changes in actual biomass stocks. Changes in biomass stocks need to exceed the detection limit in order to be detectable, e.g. in monitoring or stocktaking efforts such as foreseen in the Paris Agreement.

References

References for Extended Data

    1. Bazilevich NI, Rodin LY, Rozov NN. Geographical Aspects of Biological Productivity. Sov Geogr. 1971;12:293–317.
    1. Pan Y, Birdsey RA, Phillips OL, Jackson RB. The Structure, Distribution, and Biomass of the World’s Forests. Annu Rev Ecol Evol Syst. 2013;44:593–622.
    1. Prentice IC, Harrison SP, Bartlein PJ. Global vegetation and terrestrial carbon cycle changes after the last ice age. New Phytol. 2011;189:988–998. - PubMed
    1. Hurtt G, et al. Harmonization of land-use scenarios for the period 1500–2100: 600 years of global gridded annual land-use transitions, wood harvest, and resulting secondary lands. Clim Change. 2011;109:117–161.
    1. Whittaker RH, Likens GE. Primary production: the biosphere and man. Hum Ecol. 1973;1:357–369.

References

    1. Bloom AA, Exbrayat J-F, van der Velde IR, Feng L, Williams M. The decadal state of the terrestrial carbon cycle: Global retrievals of terrestrial carbon allocation, pools, and residence times. PNAS. 2016;113:1285–1290. - PMC - PubMed
    1. Houghton RA. Balancing the Global Carbon Budget. Annual Review of Earth and Planetary Sciences. 2007;35:313–347.
    1. Saugier B, Roy J, Mooney HA. Estimations of Global Terrestrial Productivity: Converging toward a Single Number? In: Roy J, Saugier B, Mooney HA, editors. Terrestrial Global Productivity. Academic Press; 2001. pp. 543–557.
    1. Stocker TF, Qin D, Plattner G-K, Tignor M, Allen SK, Boschung J, Nauels A, Xia Y, Bex V, Midgley PM, editors. IPCC. Climate Change 2013: The Physical Science Basis. Contribution of Working Group I to the Fifth Assessment Report of the Intergovernmental Panel on Climate Change. Cambridge University Press; 2013.
    1. GTOS. Biomass. Food and Agriculture Organization of the United Nations; 2009.

Publication types