. 2017 Dec 19;18(1):974.
doi: 10.1186/s12864-017-4355-5.

Comparative transcriptome analysis of Glyphodes pyloalis Walker (Lepidoptera: Pyralidae) reveals novel insights into heat stress tolerance in insects

Affiliations

Comparative transcriptome analysis of Glyphodes pyloalis Walker (Lepidoptera: Pyralidae) reveals novel insights into heat stress tolerance in insects

Yuncai Liu et al. BMC Genomics. .

Abstract

Background: Heat tolerance is a key parameter that affects insect distribution and abundance. Glyphodes pyloalis Walker (Lepidoptera: Pyralidae) is a devastating pest of mulberry in the main mulberry-growing regions and can cause tremendous losses to sericulture by directly feeding on mulberry leaves and transmitting viruses to Bombyx mori. Moreover, G. pyloalis shows a prominent capacity for adaptation to daily and seasonal temperature fluctuations and can survive several hours under high temperature. To date, the molecular mechanism underlying the outstanding adaptability of this pest to high temperature remains unclear.

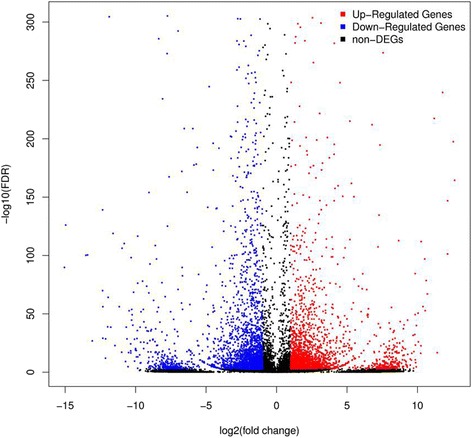
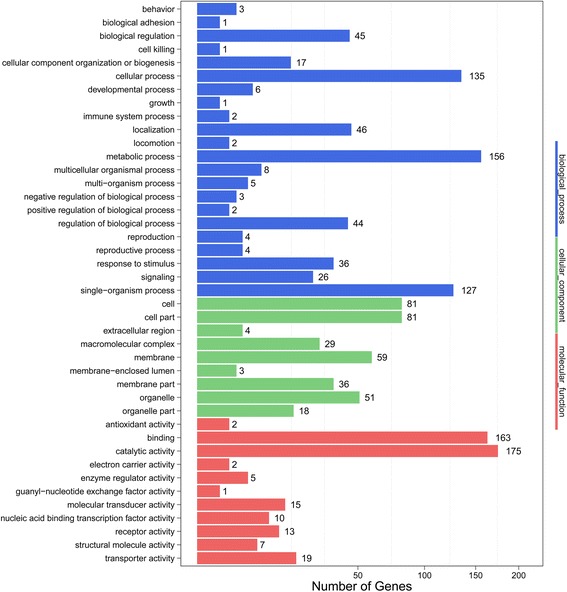
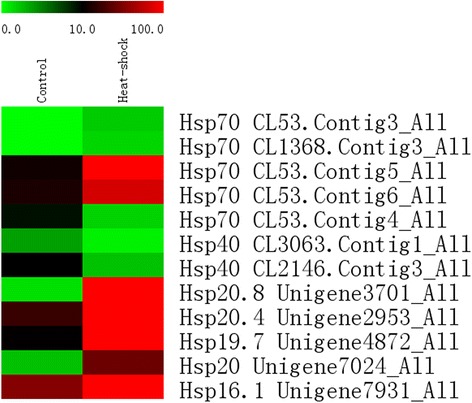
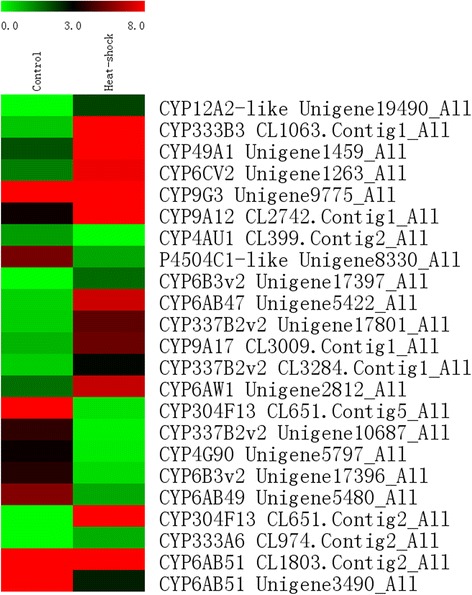
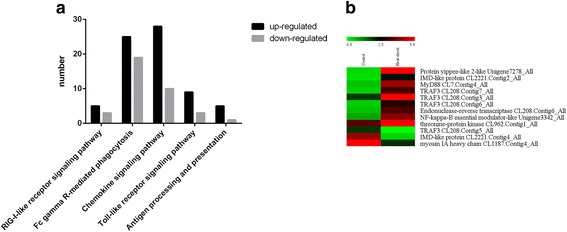
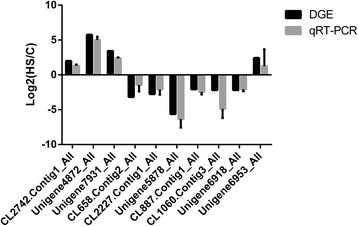
Results: In this study, we performed comparative transcriptome analyses on G. pyloalis exposed to 25 and 40 °C for 4 h. We obtained 34,034 unigenes and identified 1275 and 1222 genes significantly upregulated or downregulated, respectively, by heat stress. Data from the transcriptome analyses indicated that some processes involved in heat tolerance are conserved, such as high expression of heat shock protein (HSP) genes and partial repression of metabolism progress. In addition, vitamin digestion and absorption pathways and detoxification pathways identified here provided new insights for the investigation of the molecular mechanisms of heat stress tolerance. Furthermore, transcriptome analysis indicated that immune and phosphatidylinositol signaling system have a close relationship with heat tolerance. In addition, the expression patterns of ten randomly selected genes, such as HSP and cytochrome P450, were consistent with the transcriptome results obtained through quantitative real-time PCR.

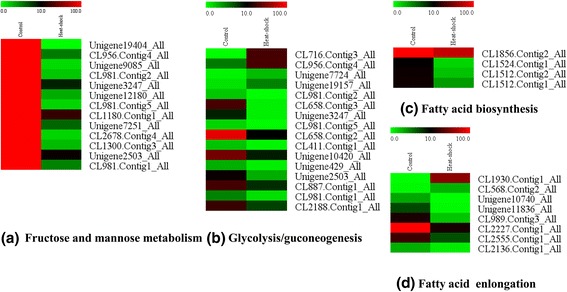
Conclusions: Comparisons among transcriptome results revealed the upregulation of HSPs and genes involved in redox homeostasis, detoxication, and immune progress. However, many metabolism progresses, such as glycolysis/gluconeogenesis and fatty acid biosynthesis, were partially repressed. The results reflected that the heat tolerance of G. pyloalis is a fairly complicated process and related to a broad range of physiological regulations. Our study can improve understanding on the mechanisms of insect thermal tolerance.

Keywords: Glyphodes pyloalis; Heat shock protein; Heat stress; Immune; Metabolism; RNA-Seq; Redox homeostasis.


Conflict of interest statement

Ethics approval and consent to participate

Not applicable.

Consent for publication

Not applicable.

Competing interests

I confirm that I have read BioMed Central’s guidance on competing interests and have included a statement in the manuscript on any competing interests. The authors declare no competing financial interests.

Publisher’s Note

Springer Nature remains neutral with regard to jurisdictional claims in published maps and institutional affiliations.

Figures

Fig. 1
Fig. 1
Morphological changes of midgut with different treatments. Morphological changes of B. mori (A–B) and G. pyloalis (C–D) were observed. Each (a) is a picture with low magnification, and the blank-lined area is shown in (b) with high magnification. Minimal bubble-like structure was observed in G. pyloalis after 4 h of heat treatment. However, many bubble-like structures (indicated by arrowheads) were produced in B. mori. Bars: A–a, B–a, C–a, and D–a: 10 μm; A–b, B–b, C–b, and D–a: 3.3 μm
Fig. 2
Fig. 2
DEGs in the midgut after different temperature treatments. The variability pattern was displayed by volcano plot. Y axis represents −log10 significance. X axis represents log2-fold change. Red points represent upregulated genes. Blue points represent downregulated genes based on the discriminative significance values (|fold change| ≥ 4.0 and FDR ≤ 0.001) adopted in this study
Fig. 3
Fig. 3
GO enrichment analysis revealed the biological processes most associated with detected DEGs. Based on the GO results, cellular progress, metabolic progress, binding, and catalytic activity were the most enriched GO terms under heat stress
Fig. 4
Fig. 4
Comparative distribution of HSP coding genes between two samples. High temperature resulted in gene expression related to HSP70, HSP40, and small HSP. The color scale is displayed at the upper left, which encompasses from the lowest (green) to the highest (red) RPKM value
Fig. 5
Fig. 5
Heatmap of the expression level of different pathways. Expression level of some genes of fructose and mannose metabolism, glycolysis/gluconeogenesis, fatty acid biosynthesis, and fatty acid elongation was shown in a, b, c, and d, respectively. The color scale is shown at the upper left, which encompasses from the lowest (green) to the highest (red) RPKM value
Fig. 6
Fig. 6
Heatmap of the different expression of cytochrome P450 genes under different heat treatment temperatures. The color scale is shown at the upper left, which encompasses from the lowest (green) to the highest (red) RPKM value
Fig. 7
Fig. 7
General statistics on gene regulation under different temperatures and heatmap of the expression level of Toll-like receptor signaling pathways. a Numbers of upregulated and downregulated genes associated with various immune events. b Heatmap of genes related to Toll-like receptor signaling pathways. The color scale is shown at the upper left, which encompasses from the lowest (green) to the highest (red) RPKM value
Fig. 8
Fig. 8
qRT-PCR analysis of the expression levels of ten unigenes. X axis represents different unigenes. CL2742.Contig1_All, cytochrome P450 9G3; Unigene4872_All, HSP 19.7; Unigene7931_All, HSP 16.1; CL658.Contig2_All, aldehyde dehydrogenase family of seven members A1; CL2227.Contig1_All, acetyltransferase 1; Unigene5878_All, hemolymph juvenile hormone-binding protein; CL887.Contig1_All, aldose 1-epimerase-like; CL1060.Contig3_All, 17-beta-hydroxysteroid dehydrogenase; Unigene6918_All, Hematopoietically-expressed homeobox protein HHEX homolog; Unigene6953_All, cytochrome P450 B5. Y axis represents the relative expression levels of genes. Ribosomal protein L32 (Rpl32) was used as an internal control

Similar articles

Cited by

References

    1. Hallman GJ, Denlinger DL. Temperature sensitivity in insects and application in integrated pest management. 1998.
    1. Zhang G, Xingliang XU, Zhou C, Zhang H, Hua O. Responses of vegetation changes to climatic variations in Hulun Buir grassland in past 30 years. Acta Geograph Sin. 2011;66(1):47–58.
    1. Hercus MJ, Loeschcke V, Rattan SIS. Lifespan extension of Drosophila Melanogaster through hormesis by repeated mild heat stress. Biogerontology. 2003;4(3):149–156. doi: 10.1023/A:1024197806855. - DOI - PubMed
    1. Manjunatha HB, Rajesh RK, Aparna HS. Silkworm thermal biology: A review of heat shock response, heat shock proteins and heat acclimation in the domesticated silkworm, Bombyx mori. J Insect Sci. 2010;10(204):204. - PMC - PubMed
    1. Pieterse W, Terblanche JS, Addison P. Do thermal tolerances and rapid thermal responses contribute to the invasion potential of Bactrocera Dorsalis (Diptera: Tephritidae)? J Insect Physiol. 2017;98:1–6. doi: 10.1016/j.jinsphys.2016.11.004. - DOI - PubMed

LinkOut - more resources