

Genetic Architecture of the Cardiovascular Risk Proteome
- PMID: 29258991
- PMCID: PMC5849518
- DOI: 10.1161/CIRCULATIONAHA.117.029536
Genetic Architecture of the Cardiovascular Risk Proteome
Abstract
Background: We recently identified 156 proteins in human plasma that were each associated with the net Framingham Cardiovascular Disease Risk Score using an aptamer-based proteomic platform in Framingham Heart Study Offspring participants. Here we hypothesized that performing genome-wide association studies and exome array analyses on the levels of each of these 156 proteins might identify genetic determinants of risk-associated circulating factors and provide insights into early cardiovascular pathophysiology.
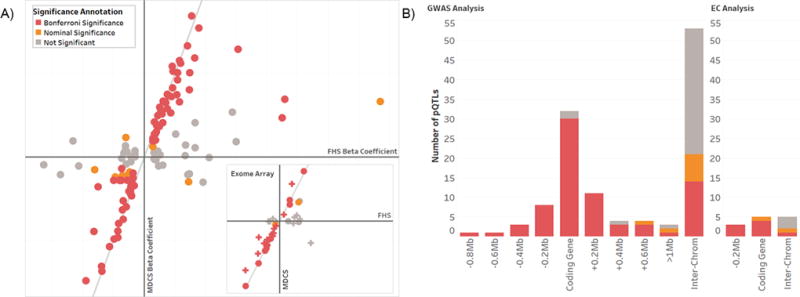
Methods: We studied the association of genetic variants with the plasma levels of each of the 156 Framingham Cardiovascular Disease Risk Score-associated proteins using linear mixed-effects models in 2 population-based cohorts. We performed discovery analyses on plasma samples from 759 participants of the Framingham Heart Study Offspring cohort, an observational study of the offspring of the original Framingham Heart Study and their spouses, and validated these findings in plasma samples from 1421 participants of the MDCS (Malmö Diet and Cancer Study). To evaluate the utility of this strategy in identifying new biological pathways relevant to cardiovascular disease pathophysiology, we performed studies in a cell-model system to experimentally validate the functional significance of an especially novel genetic association with circulating apolipoprotein E levels.
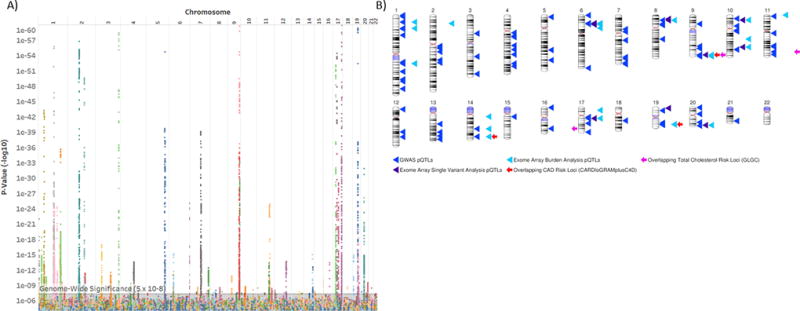
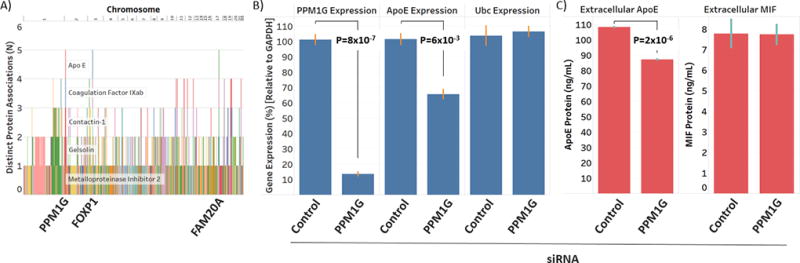
Results: We identified 120 locus-protein associations in genome-wide analyses and 41 associations in exome array analyses, the majority of which have not been described previously. These loci explained up to 66% of interindividual plasma protein-level variation and, on average, accounted for 3 times the amount of variation explained by common clinical factors, such as age, sex, and diabetes mellitus status. We described overlap among many of these loci and cardiovascular disease genetic risk variants. Finally, we experimentally validated a novel association between circulating apolipoprotein E levels and the transcription factor phosphatase 1G. Knockdown of phosphatase 1G in a human liver cell model resulted in decreased apolipoprotein E transcription and apolipoprotein E protein levels in cultured supernatants.
Conclusions: We identified dozens of novel genetic determinants of proteins associated with the Framingham Cardiovascular Disease Risk Score and experimentally validated a new role for phosphatase 1G in lipoprotein biology. Further, genome-wide and exome array data for each protein have been made publicly available as a resource for cardiovascular disease research.
Keywords: APOE; cardiovascular genomics; genome-wide analysis; proteomics; systems biology.
© 2017 American Heart Association, Inc.
Conflict of interest statement
The authors have declared that no conflict of interest exists.
Figures

Comment in
-
Integrative Omics: Harnessing the Proteome to Maximize the Potential of the Genome.Circulation. 2018 Mar 13;137(11):1173-1175. doi: 10.1161/CIRCULATIONAHA.117.032807. Circulation. 2018. PMID: 29530892 No abstract available.
References
-
- Gold L, Ayers D, Bertino J, Bock C, Bock A, Brody EN, Carter J, Dalby AB, Eaton BE, Fitzwater T, Flather D, Forbes A, Foreman T, Fowler C, Gawande B, Goss M, Gunn M, Gupta S, Halladay D, Heil J, Heilig J, Hicke B, Husar G, Janjic N, Jarvis T, Jennings S, Katilius E, Keeney TR, Kim N, Koch TH, Kraemer S, Kroiss L, Le N, Levine D, Lindsey W, Lollo B, Mayfield W, Mehan M, Mehler R, Nelson SK, Nelson M, Nieuwlandt D, Nikrad M, Ochsner U, Ostroff RM, Otis M, Parker T, Pietrasiewicz S, Resnicow DI, Rohloff J, Sanders G, Sattin S, Schneider D, Singer B, Stanton M, Sterkel A, Stewart A, Stratford S, Vaught JD, Vrkljan M, Walker JJ, Watrobka M, Waugh S, Weiss A, Wilcox SK, Wolfson A, Wolk SK, Zhang C, Zichi D. Aptamer-based multiplexed proteomic technology for biomarker discovery. PLoS One. 2010;5:e15004. - PMC - PubMed
-
- Ngo D, Sinha S, Shen D, Kuhn EW, Keyes MJ, Shi X, Benson MD, O'Sullivan JF, Keshishian H, Farrell LA, Fifer MA, Vasan RS, Sabatine MS, Larson MG, Carr SA, Wang TJ, Gerszten RE. Aptamer-Based Proteomic Profiling Reveals Novel Candidate Biomarkers and Pathways in Cardiovascular Disease. Circulation. 2016;134:270–85. - PMC - PubMed
-
- Suhre K, Shin SY, Petersen AK, Mohney RP, Meredith D, Wägele B, Altmaier E, Deloukas P, Erdmann J, Grundberg E, Hammond CJ, de Angelis MH, Kastenmüller G, Köttgen A, Kronenberg F, Mangino M, Meisinger C, Meitinger T, Mewes HW, Milburn MV, Prehn C, Raffler J, Ried JS, Römisch-Margl W, Samani NJ, Small KS, Wichmann HE, Zhai G, Illig T, Spector TD, Adamski J, Soranzo N, Gieger C CARDIoGRAM. Human metabolic individuality in biomedical and pharmaceutical research. Nature. 2011;477:54–60. - PMC - PubMed
-
- Rhee EP, Ho JE, Chen MH, Shen D, Cheng S, Larson MG, Ghorbani A, Shi X, Helenius IT, O'Donnell CJ, Souza AL, Deik A, Pierce KA, Bullock K, Walford GA, Vasan RS, Florez JC, Clish C, Yeh JR, Wang TJ, Gerszten RE. A genome-wide association study of the human metabolome in a community-based cohort. Cell Metab. 2013;18:130–43. - PMC - PubMed
Publication types
MeSH terms
Substances
Grants and funding
LinkOut - more resources
Full Text Sources
Other Literature Sources
Miscellaneous
