. 2018 Mar 1;78(5):1225-1240.
doi: 10.1158/0008-5472.CAN-17-1089. Epub 2017 Dec 19.

The CARMA3-Bcl10-MALT1 Signalosome Drives NFκB Activation and Promotes Aggressiveness in Angiotensin II Receptor-Positive Breast Cancer

Affiliations

The CARMA3-Bcl10-MALT1 Signalosome Drives NFκB Activation and Promotes Aggressiveness in Angiotensin II Receptor-Positive Breast Cancer

Prasanna Ekambaram et al. Cancer Res. .

Abstract

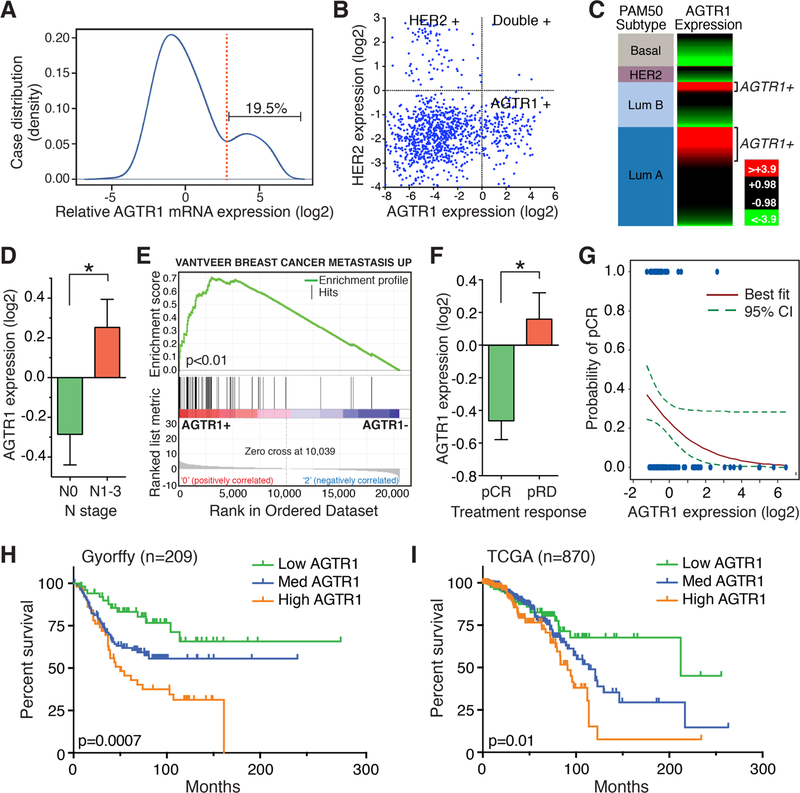
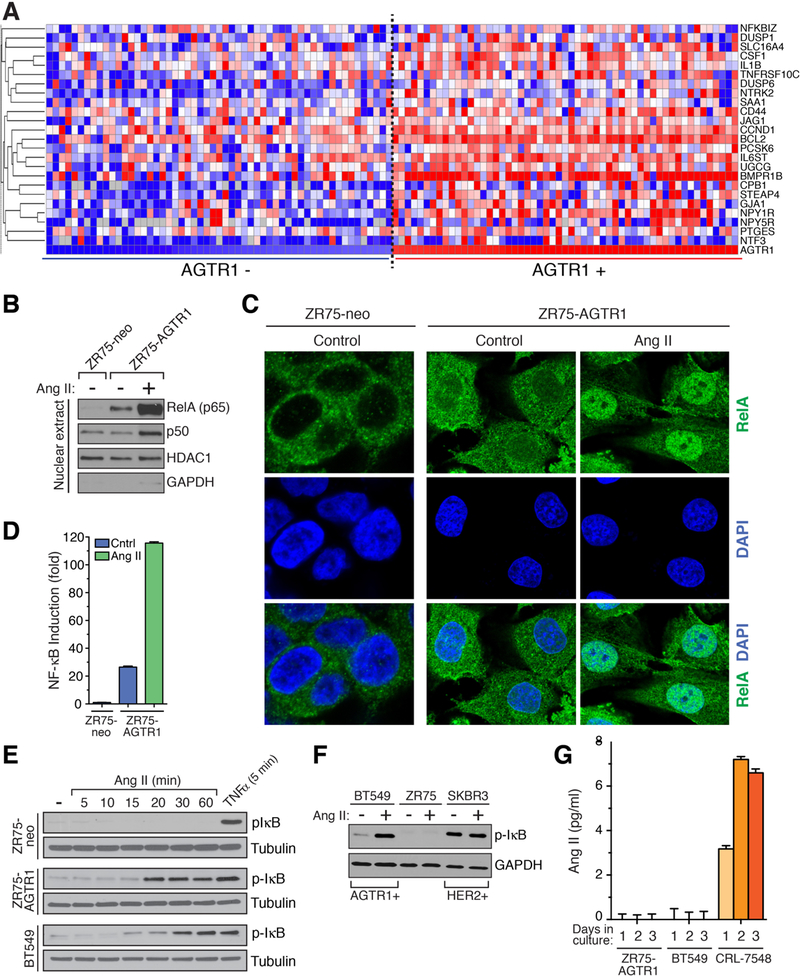
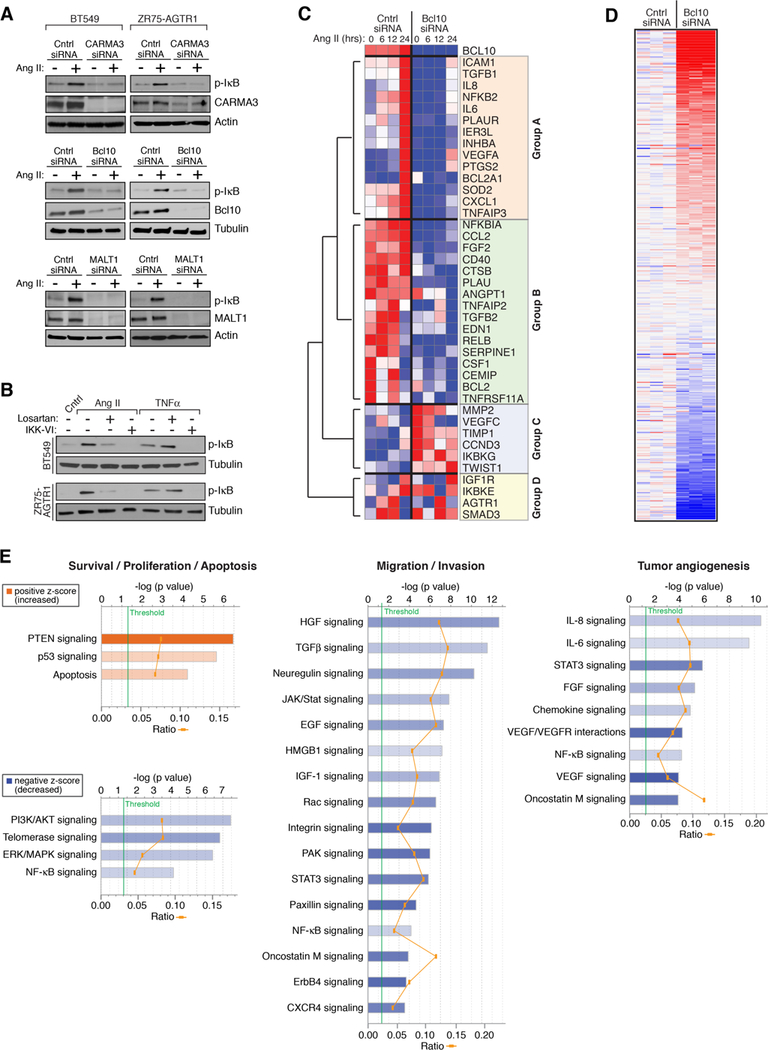
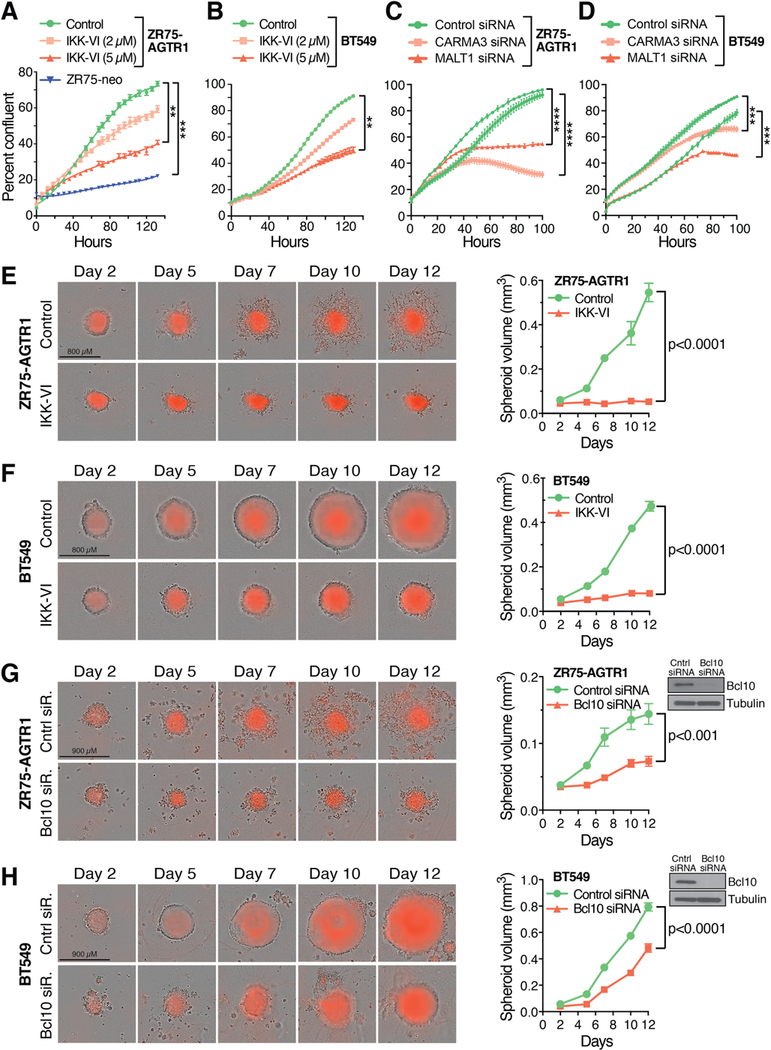
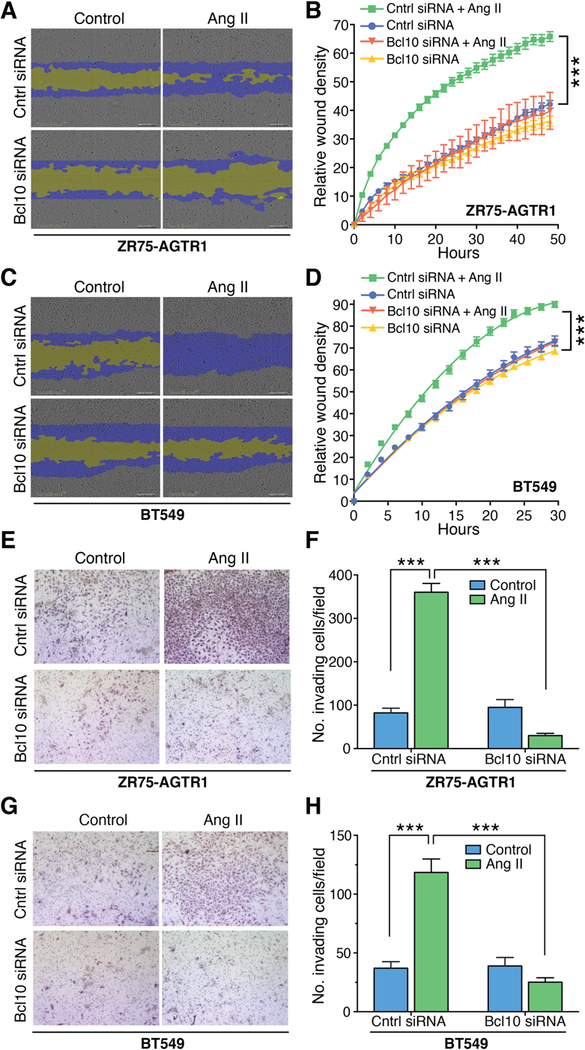
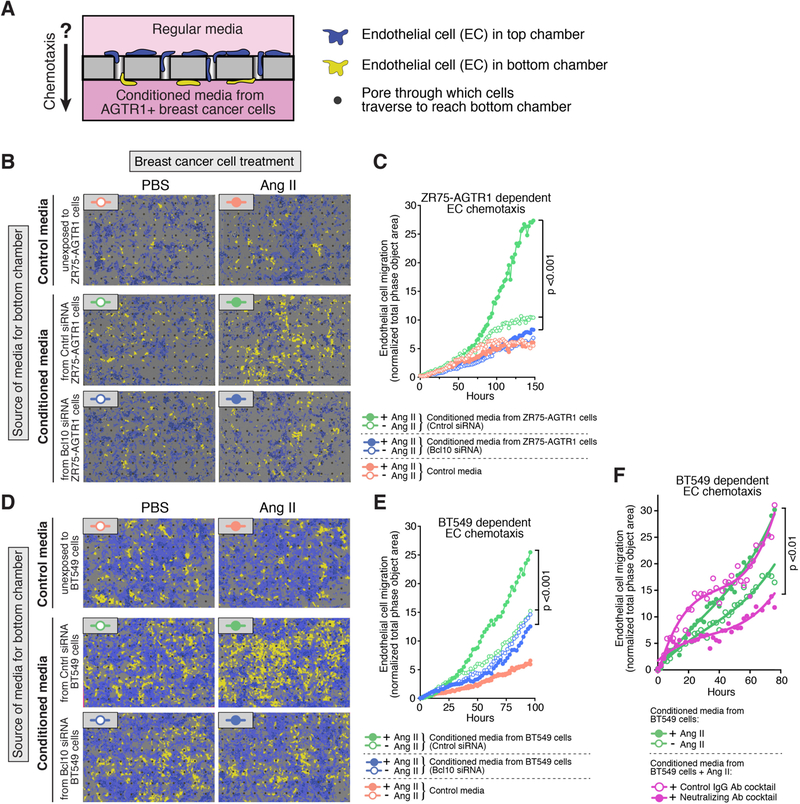
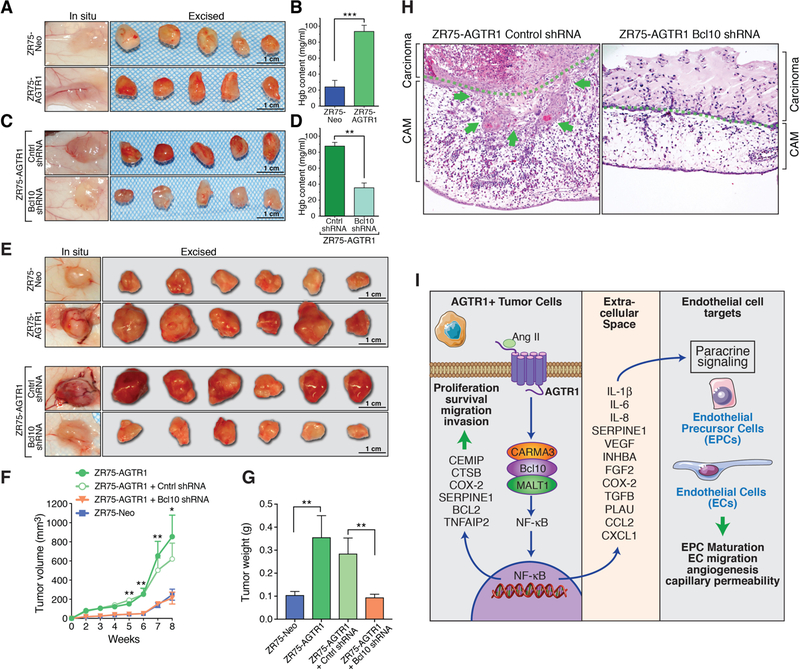
The angiotensin II receptor AGTR1, which mediates vasoconstrictive and inflammatory signaling in vascular disease, is overexpressed aberrantly in some breast cancers. In this study, we established the significance of an AGTR1-responsive NFκB signaling pathway in this breast cancer subset. We documented that AGTR1 overexpression occurred in the luminal A and B subtypes of breast cancer, was mutually exclusive of HER2 expression, and correlated with aggressive features that include increased lymph node metastasis, reduced responsiveness to neoadjuvant therapy, and reduced overall survival. Mechanistically, AGTR1 overexpression directed both ligand-independent and ligand-dependent activation of NFκB, mediated by a signaling pathway that requires the triad of CARMA3, Bcl10, and MALT1 (CBM signalosome). Activation of this pathway drove cancer cell-intrinsic responses that include proliferation, migration, and invasion. In addition, CBM-dependent activation of NFκB elicited cancer cell-extrinsic effects, impacting endothelial cells of the tumor microenvironment to promote tumor angiogenesis. CBM/NFκB signaling in AGTR1+ breast cancer therefore conspires to promote aggressive behavior through pleiotropic effects. Overall, our results point to the prognostic and therapeutic value of identifying AGTR1 overexpression in a subset of HER2-negative breast cancers, and they provide a mechanistic rationale to explore the repurposing of drugs that target angiotensin II-dependent NFκB signaling pathways to improve the treatment of this breast cancer subset.Significance: These findings offer a mechanistic rationale to explore the repurposing of drugs that target angiotensin action to improve the treatment of AGTR1-expressing breast cancers. Cancer Res; 78(5); 1225-40. ©2017 AACR.


Conflict of interest statement

Disclosure of Potential Conflicts of Interest:

S.A. Tomlins is a consultant for and receives honoraria from Roche/Ventana Medical Systems, Almac Diagnostics, Jansenn, AbbVie, Astellas/Medivation and Sanofi. S.A. Tomlins has sponsored research agreements with Compendia Biosciences/Life Technologies/ThermoFisher Scientific, Astellas and GenomeDX. D.R. Rhodes and S.A. Tomlins are Co-founders and equity holders in Strata Oncology. A.M. Chinnaiyan and D.R. Rhodes were Co-founders of Compendia Biosciences.

No potential conflicts of interest were disclosed by the other authors.

Figures

Figure 1.
Figure 1.. AGTR1 is expressed in a subset of breast cancers and is associated with aggressive disease.
A, kernel density plot analysis for AGTR1 mRNA expression in TCGA invasive breast cancer, based on Agilent microarray v1 data (n=526). B, scatter plot of HER2 and AGTR1 mRNA expression in the same TCGA cases. C, heatmap subcategorization of AGTR1+ cases in luminal A and B categories based on PAM50 subtype analysis (n=1094, scale: log2 mean centered). D, AGTR1 expression as a function of N stage (nodal status) for invasive ductal carcinoma, based on TCGA data (n=756; *, p=0.01). E, GSEA performed on AGTR1-stratified breast cancers in the TCGA collection using the “VANTVEER_BREAST_CANCER_METASTASIS_UP” gene set. F, AGTR1 mRNA expression as a function of response to neoadjuvant chemotherapy. Patients undergoing 24 weeks of preoperative therapy with paclitaxel and fluorouracil-doxorubicin-cyclophosphamide (T/FAC) were analyzed for pathologic response at the time of subsequent surgery (pCR, pathologic complete response; pRD, pathologic residual disease; n=133; *, p=0.01). G, data from panel F are used to construct a pCR probability curve based on AGTR1 expression. Blue dots represent individual patients with either pCR or pRD. H and I, Kaplan-Meier survival curves based on AGTR1 expression (quartiles). Panel H shows outcomes (relapse-free survival; RFS) for patients with high-grade ER+, luminal B tumors in the Gyorffy meta-analysis and panel I shows outcomes (overall survival; OS) for ductal cancers in the TCGA dataset. P values generated by the Mantel-Cox test are indicated.
Figure 2.
Figure 2.. AGTR1 drives NF-κB activity in breast cancer.
A, heatmap of expression (high=red, low=blue) for key NF-κB regulated genes in luminal A/B breast cancer cases with the highest versus lowest AGTR1 expression (top/bottom 10% from TCGA dataset). B and C, nuclear translocation of NF-κB subunits (RelA and p50) in AGTR1-expressing ZR75 cells, ± 1 hr Ang II, as assessed by Western analysis of nuclear fractions (B), and by immunofluorescence (C). Nuclear extract integrity is demonstrated by the presence of nuclear protein, HDAC1, and the absence of contaminating cytoplasmic protein, GAPDH. D, NF-κB luciferase reporter activity in ZR75-derived lines ± Ang II (mean ± SEM, n=3). E, Ang II-dependent NF-κB activation in AGTR1+ cells, as measured by Western blot for p-IkB. TNFa is used as a positive control. F, NF-κB activity in BT549 cells as compared to the HER2+, SKBR3 line. G, Ang II levels, as measured by ELISA, within media taken from the culture of the indicated cell lines (mean ± SD, n=3).
Figure 3.
Figure 3.. The CBM signalosome mediates NF-κB activation and gene expression reprogramming in AGTR1+ breast cancer.
A, effect of siRNA-mediated knockdown of each individual component of the CBM signalosome on Ang II-dependent NF-κB activation in either BT549 or ZR75-AGTR1 cells. B, effect of losartan (5 µM) or IKK-VI (5 µM) on Ang II-dependent NF-κB activation in AGTR1+ breast cancer lines. As expected, the response to TNFα is blocked only by IKK-VI and not losartan. C, siRNA-mediated Bcl0 knockdown in BT549 cells and effect on NF-κB gene targets. D, heatmap of gene expression changes in BT549 cells following Bcl10 knockdown by siRNA, in biological triplicate (upregulated=red, downregulated=blue). Analysis includes 487 genes from the Nanostring Pancancer Progression codeset for which expression could be reliably determined. E, Ingenuity Pathway Analysis (IPA) based on data from panel (D). Bar graphs indicate level of significance of change in the indicated pathways (-log p value). Increasingly dark blue color indicates greater reduction in pathway activity, while increasingly dark orange color indicates greater enhancement.
Figure 4.
Figure 4.. The CBM/NF-κB pathway is critical for AGTR1-dependent cell proliferation.
A and B, proliferation of ZR75-AGTR1 and BT549 cells in 2D, ± IKK-VI, as assessed using the quantitative IncuCyte system (mean ± SEM, n=4; **, p<0.01; ***, p<0.001). C and D, proliferation of the ZR75-AGTR1 and BT549 cell lines ± CARMA3 or MALT1 knockdown (mean SEM, n=3; ***, p<0.001; ****, p<0.0001). E and F, growth of ZR75-AGTR1 and BT549 spheroids ± IKK-VI (mean ± SEM, n=12). G and H, growth of ZR75-AGTR1 and BT549 spheroids ± Bcl10 knockdown (mean ± SEM, n=12).
Figure 5.
Figure 5.. The CBM pathway is critical for Ang II-induced cell migration and invasion.
A and B, ZR75-AGTR1 cell migration was monitored in a real-time scratch assay, using the IncuCyte system. Representative scratch wounds are shown at the conclusion of the experiment. The region of the original scratch is pseudo-colored in yellow and the area of cell migration into the scratch is overlaid in blue/purple. Wound density (closure) is plotted as a continuous function of time (mean ± SEM, n=5; ***, p<0.001). C and D, BT549 cell migration was monitored as described for ZR75-AGTR1 cells (mean ± SEM, n=11; ***, p<0.001). E and F, ZR75-AGTR1 cell invasiveness as measured using matrigel-coated Boyden chambers (mean ± SEM, n=3; ***, p<0.001). G and H, BT549 cell invasiveness as measured in Boyden chambers (mean ± SEM, n=3; ***, p<0.001).
Figure 6.
Figure 6.. The CBM pathway is critical for paracrine-mediated chemotactic signaling to endothelial cells.
A, schematic of the IncuCyte-based, endothelial chemotaxis assay system. B-E, HUVEC endothelial cells were tested for chemotactic migration towards distinct sources of media placed in the bottom chamber. Representative static images showing both endothelial cells that completed migration (yellow) and those that did not (blue) at the conclusion of experiments are shown. Panels C and E show quantitative measures of endothelial chemotaxis as a continuous function of time, (n=4). F, effect of a cocktail of neutralizing antibodies against IL-1β, IL-6, IL-8, SERPINE1 (PAI-1), VEGFA, and INHBA, on induced endothelial chemotaxis. Antibodies were incubated with conditioned media from Ang II-treated BT549 cells for 1 hr before proceeding to the chemotaxis assay. An isotype-matched control antibody cocktail was used as a negative control.
Figure 7.
Figure 7.. The CBM pathway is critical for tumor angiogenesis in vivo.
A and B, ZR75-AGTR1 cells were compared to control ZR75-neo cells for evidence of tumor-induced angiogenesis, using a subcutaneous angiogenesis plug assay in nude mice. Five representative excised plugs from each group (out of n=12/group) are shown. Panel B shows quantification of hemoglobin content of excised plugs (mean ± SEM, n=6; ***, p<0.001). C and D, plugs containing ZR75-AGTR1 cells with control versus Bcl10 knockdown. Plugs composed of Bcl10 knockdown cells were markedly pale relative to control counterparts and showed reduced hemoglobin content (mean ± SEM, n=6; **, p<0.01). E-G, enforced AGTR1 expression in ZR75 cells confers enhanced xenograft growth in vivo, which is fully abrogated by shRNA-mediated Bcl10 knockdown. Photos show the six largest xenografts from each group (out of n=10–12). Quantification of tumor volume and final weights are shown in panels F and G (mean ± SEM, n=10–12; **, p<0.01). Xenografts composed of cells expressing AGTR1 were also grossly more vascularized. Knockdown of Bcl10 strongly abrogated vascularization in addition to impairing tumor growth. H, representative photomicrographs (200x) of CAMs after four days of exposure to ZR75-AGTR1 cancer cells (± Bcl10 knockdown), placed on the CAM surface (n=7). Green dotted line indicates the level of the CAM surface epithelium, representing the interface between the breast cancer cells and the underlying membrane. Green arrows highlight an area of disruption in the surface epithelium, with underlying tissue reaction. I, schematic summarizing both cancer cell intrinsic and extrinsic effects of AGTR1 overexpression in breast cancer that likely conspire to promote aggressive phenotype.

Similar articles

Cited by

References

    1. Senkus E, Cardoso F, Pagani O. Time for more optimism in metastatic breast cancer? Cancer Treat Rev 2014;40:220–8. - PubMed
    1. Arteaga CL, Engelman JA. ERBB receptors: from oncogene discovery to basic science to mechanism-based cancer therapeutics. Cancer Cell 2014;25:282–303. - PMC - PubMed
    1. Bianchini G, Balko JM, Mayer IA, Sanders ME, Gianni L. Triple-negative breast cancer: challenges and opportunities of a heterogeneous disease. Nat Rev Clin Oncol 2016;13:674–90. - PMC - PubMed
    1. Tran B, Bedard PL. Luminal-B breast cancer and novel therapeutic targets. Breast Cancer Res 2011;13:221. - PMC - PubMed
    1. Rhodes DR, Ateeq B, Cao Q, Tomlins SA, Mehra R, Laxman B, et al. AGTR1 overexpression defines a subset of breast cancer and confers sensitivity to losartan, an AGTR1 antagonist. Proc Natl Acad Sci U S A 2009;106:10284–9. - PMC - PubMed

Publication types

MeSH terms

Substances