. 2018 Feb 15;78(4):1044-1057.
doi: 10.1158/0008-5472.CAN-17-1904. Epub 2017 Dec 19.

ER Stress Signaling Promotes the Survival of Cancer "Persister Cells" Tolerant to EGFR Tyrosine Kinase Inhibitors

Affiliations

ER Stress Signaling Promotes the Survival of Cancer "Persister Cells" Tolerant to EGFR Tyrosine Kinase Inhibitors

Hideki Terai et al. Cancer Res. .

Abstract

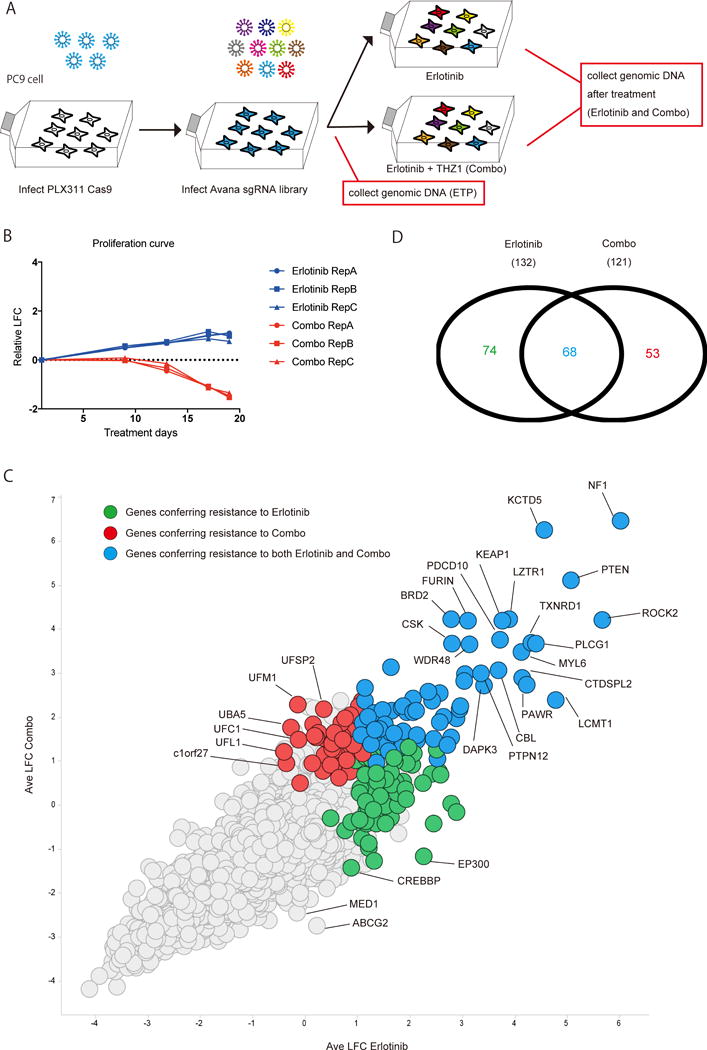
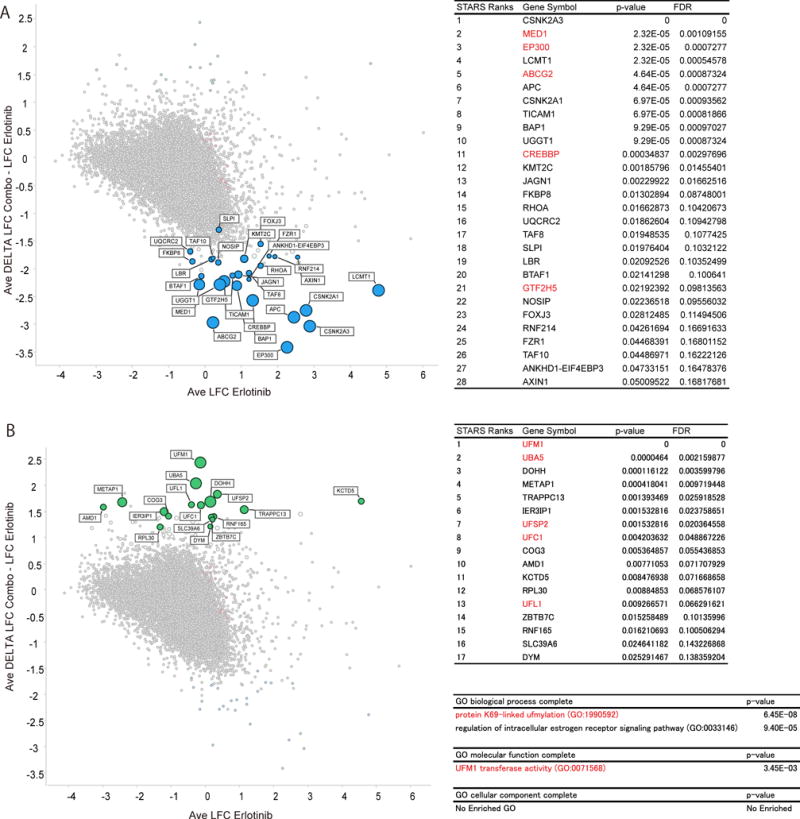
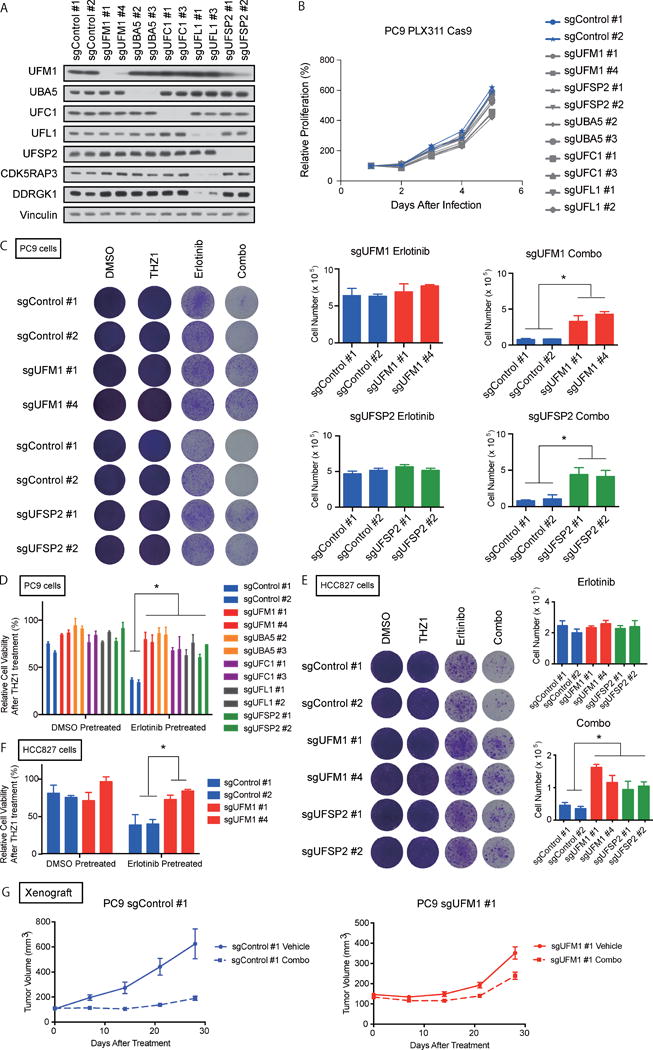
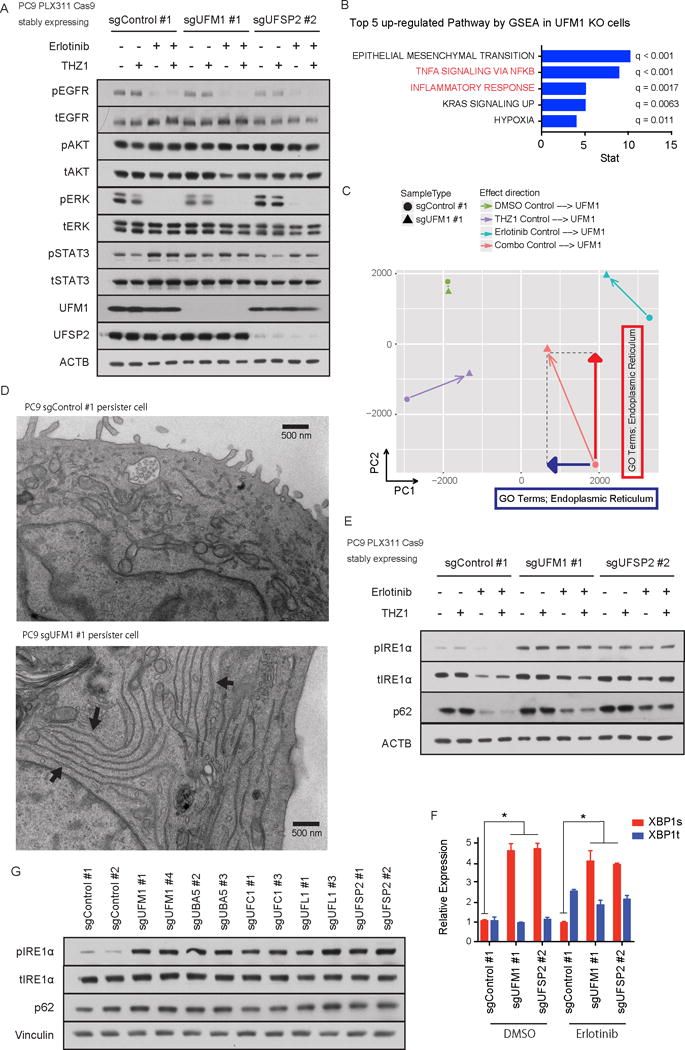
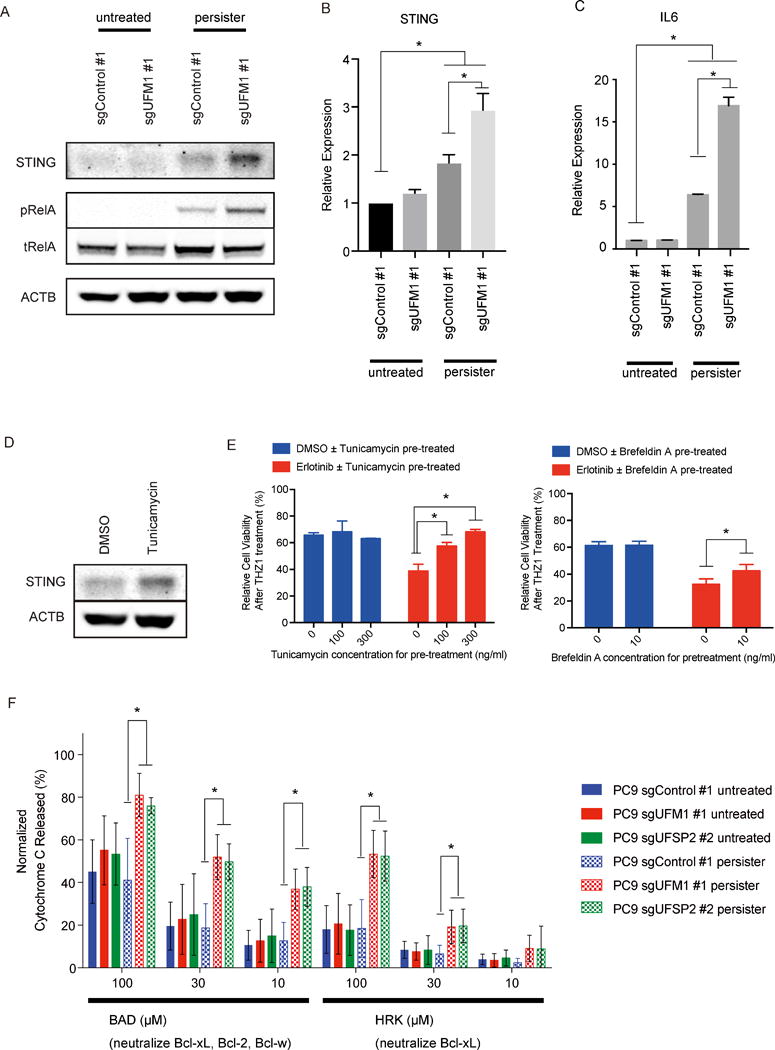
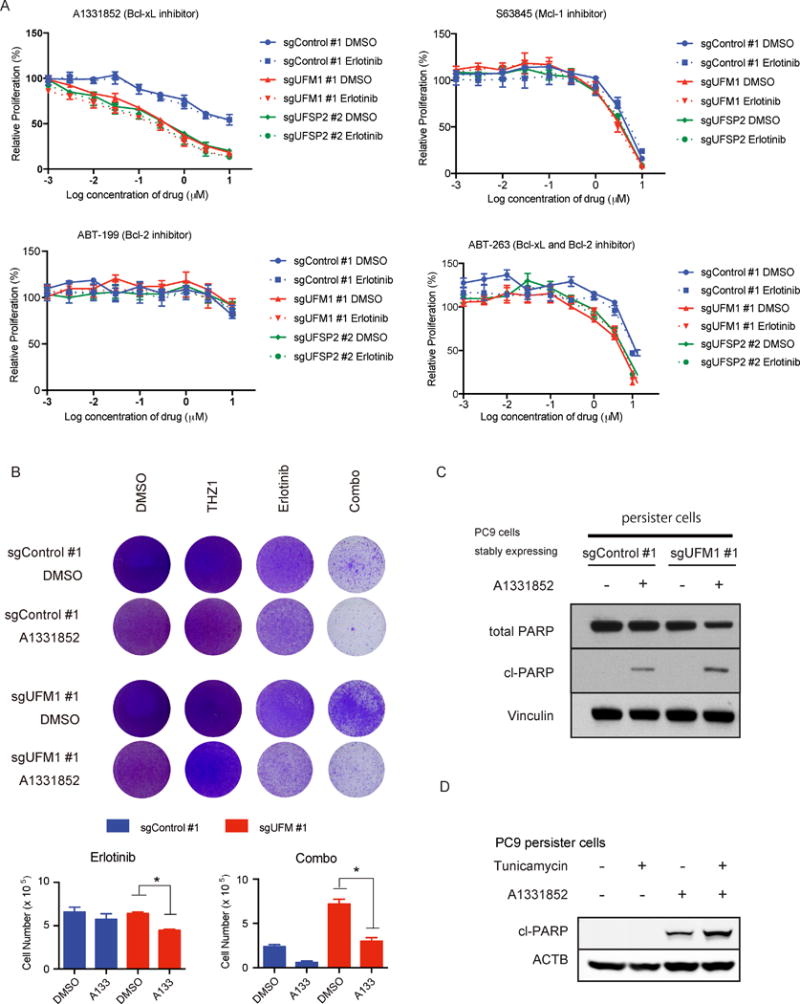
An increasingly recognized component of resistance to tyrosine kinase inhibitors (TKI) involves persistence of a drug-tolerant subpopulation of cancer cells that survive despite effective eradication of the majority of the cell population. Multiple groups have demonstrated that these drug-tolerant persister cells undergo transcriptional adaptation via an epigenetic state change that promotes cell survival. Because this mode of TKI drug tolerance appears to involve transcriptional addiction to specific genes and pathways, we hypothesized that systematic functional screening of EGFR TKI/transcriptional inhibitor combination therapy would yield important mechanistic insights and alternative drug escape pathways. We therefore performed a genome-wide CRISPR/Cas9 enhancer/suppressor screen in EGFR-dependent lung cancer PC9 cells treated with erlotinib + THZ1 (CDK7/12 inhibitor) combination therapy, a combination previously shown to suppress drug-tolerant cells in this setting. As expected, suppression of multiple genes associated with transcriptional complexes (EP300, CREBBP, and MED1) enhanced erlotinib/THZ1 synergy. Unexpectedly, we uncovered nearly every component of the recently described ufmylation pathway in the synergy suppressor group. Loss of ufmylation did not affect canonical downstream EGFR signaling. Instead, absence of this pathway triggered a protective unfolded protein response associated with STING upregulation, promoting protumorigenic inflammatory signaling but also unique dependence on Bcl-xL. These data reveal that dysregulation of ufmylation and ER stress comprise a previously unrecognized TKI drug tolerance pathway that engages survival signaling, with potentially important therapeutic implications.Significance: These findings reveal a novel function of the recently described ufmylation pathway, an ER stress survival signaling in drug-tolerant persister cells, which has important biological and therapeutic implications. Cancer Res; 78(4); 1044-57. ©2017 AACR.


Conflict of interest statement

Conflict of Interest Statement: D.A.B. is a consultant for N-of-One.

Figures

Figure 1
Figure 1. Overview of pooled sgRNA screening
Overview of genome wide CRISPR screen with PC9 cells treated by erlotinib or combination therapy. A) A work flow of CRISPR screen. PC9 cells were infected with Cas9 expressing plasmid (PLX311), selected and then transduced with Avana sgRNA library. After antibiotic selection, PC9 cells were treated with 100nM erlotinib ± 50nM THZ1 for 18 days. Genomic DNA was isolated from each cell population before (ETP: early time point sample) and after treatment, then analyzed by next generation sequencing to see the enrichment or depletion of each sgRNA. B) Proliferation curves of PC9 cells infected with sgRNA library under the indicated treatment. C) Scatter plot for the result of CRISPR screen. Each dot indicates average of 4 sgRNAs for one target gene. Horizontal axis and vertical axis indicate log 2 fold change of sgRNA during erlotinib treatment or combination treatment compared with early time point sample. D) Venn diagram indicate the number of genes significantly enriched (FDR <0.25) after the treatments by the STARS algorithm (28).
Figure 2
Figure 2. Identified synergy enhancers and synergy suppressors
Genome wide CRISPR screen dissects synergistic effect of THZ1. A), B) Scatter plots for synergy enhancer genes (A) or synergy suppressor genes (B). Horizontal axis indicates average log 2 fold change (LFC) from early time point sample after erlotinib treatment. Vertical axis indicates delta log 2 fold change between erlotinib treatment and combination treatment. Tables indicate the most enriched (FDR <0.25) genes ranked by STARS algorithm for synergy enhancer genes (A) or synergy suppressor genes (B). GO analysis was performed with the enriched synergy suppressor genes (B).
Figure 3
Figure 3. Absence of ufmylation pathway genes attenuates cell killing effect by THZ1 over erlotinib treatment
A) Immunoblotting analysis of ufmyation pathway genes. B) Cell proliferation assay of PC9 cells transduced indicated sgRNAs. C) Umylation pathway depleted or control PC9 cells were treated with 50 nM THZ1 (THZ1), erlotinib (Erlotinib) or 50 nM THZ1 + erlotinib (Combo) for 18 days, (100 nM erlotinib was used for PC9 cells and 30 nM erlotinib was used for HCC827, respectively). The viable number of the cells was counted by Vi-cell counter at day 18 to quantify the cell proliferation. Each bar indicates the mean and SD of triplicate. D) Ufmylation depleted PC9 cells were pre-treated with 100 nM erlotinib for 48 hrs. Then treated by 100 nM THZ1. Cells were incubated with THZ1 for 96 hr. Each bar indicate mean ± SD. E) UFM1 or UFSP2 depleted HCC827 cells were treated as in C. F) UFM1 depleted HCC827 cells were treated as in D. G) Xenograft experiments with PC9 cells transduced indicated sgRNAs. Detailed experimental procedures described in Materials and Methods in Supplemental information.
Figure 4
Figure 4. Absence of ufmylation induces inflammatory signaling and ER stress
A) Immunoblotting of EGFR signaling pathway components. UFM1 or UFSP2 depleted PC9 cells or control PC9 cells were treated with DMSO, 50 nM THZ1, 100 nM erlotinib (Erlotinib) or 50 nM THZ1 plus 100 nM erlotinib (Combo) for 72 hr. B) Top 5 up-regulated pathways in UFM1 knock out PC9 cells compared with Control PC9 cells analyzed by GSEA analysis. C) Principal component analysis (PCA) was performed for average FPKM values of each condition and resulting PCA scores were used. GO term analysis was performed against each principal component and ER GO terms were highly ranked with the indicated directions. D) Representative pictures of electron microscopic experiments. Each arrow in UFM1 KO persister cells indicates accumulation of abnormal ER. E) Immunoblotting of unfolded protein response pathway components in UFM1 or UFSP2 depleted or control PC9 cells. Cells were incubated with DMSO, 50 nM THZ1, 100 nM erlotinib (Erlotinib) or 50 nM THZ1 plus 100 nM erlotinib (Combo) for 72 hr. F) qRT-PCR of spliced or total XBP1 in PC9 cells after 100 nM erlotinib treatment. PC9 cells were transduced with indicated sgRNAs. Each bar indicates mean ± SD. G) Immunoblotting analysis of ufmylation pathway genes in PC9 cells transduced with indicated sgRNAs.
Figure 5
Figure 5. STING induction and mitochondrial priming in erlotinib DTP cells
A) Immunobloting analysis of STING in parental or erlotinib DTP PC9 cells transduced with indicated sgRNA. B, C) qRT-PCR of IL6 UFM1 knockout PC9 cells or control PC9 cells. D) Immunobloting analysis of STING in PC9 cells after the incubation with 300 ng/ml of tunicamycin for 24 hr. E) UFM1 or UFSP2 deleted PC9 cells and control PC9 cells were pre-treated with Erlotinib or DMSO for 48 hr. Pre-treatment with ER stress inducer tunicamycin or brefeldin A could attenuate the enhance effect by for following 100 nM THZ1 treatment. F) BH3 profiling revealing alteration of mitochondrial permeability following incubation with the indicated BH3 peptides.
Figure 6
Figure 6. Enhanced dependency on Bcl-xL in the absence of ufmylation
A) Drug sensitivity assay performed with UFM1 or UFSP2 depleted or control PC9 cells. Relative proliferation was measured by cell titer glo assay on day 4 after indicated treatment. B) Colony formation assay at day 18 ± 1 μM A1331852 treatment. PC9 cells transduced with indicated sgRNAs were incubated with DMSO, 50 nM THZ1, 100 nM erlotinib (Erlotinib) or 50 nM THZ1 plus 100 nM erlotinib (Combo). C) PARP immunobloting following 8 hr treatment with 1 μM A1331852 in parental or erlotinib DTP PC9 cells transduced with indicated sgRNAs. D) PARP immunoblot of parental PC9 cells and erlotinib persister PC9 cells were transduced with indicated sgRNAs. Cells were incubated with 300 ng/ml tunicamycin for 24 hr and 300 nM A1331852 for 3 hr before protein extraction.

References

    1. Holohan C, Van Schaeybroeck S, Longley DB, Johnston PG. Cancer drug resistance: an evolving paradigm. Nature reviews Cancer. 2013;13:714–26. - PubMed
    1. Stewart EL, Tan SZ, Liu G, Tsao MS. Known and putative mechanisms of resistance to EGFR targeted therapies in NSCLC patients with EGFR mutations-a review. Transl Lung Cancer Res. 2015;4:67–81. - PMC - PubMed
    1. Sharma SV, Lee DY, Li B, Quinlan MP, Takahashi F, Maheswaran S, et al. A chromatin-mediated reversible drug-tolerant state in cancer cell subpopulations. Cell. 2010;141:69–80. - PMC - PubMed
    1. Lee HJ, Zhuang G, Cao Y, Du P, Kim HJ, Settleman J. Drug resistance via feedback activation of Stat3 in oncogene-addicted cancer cells. Cancer cell. 2014;26:207–21. - PubMed
    1. Hata AN, Niederst MJ, Archibald HL, Gomez-Caraballo M, Siddiqui FM, Mulvey HE, et al. Tumor cells can follow distinct evolutionary paths to become resistant to epidermal growth factor receptor inhibition. Nature medicine. 2016;22:262–9. - PMC - PubMed

Publication types

Substances