Computation of extreme heat waves in climate models using a large deviation algorithm
- PMID: 29259112
- PMCID: PMC5776802
- DOI: 10.1073/pnas.1712645115
Computation of extreme heat waves in climate models using a large deviation algorithm
Abstract
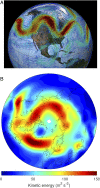
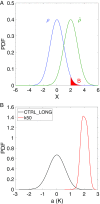
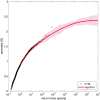
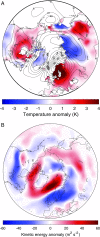
Studying extreme events and how they evolve in a changing climate is one of the most important current scientific challenges. Starting from complex climate models, a key difficulty is to be able to run long enough simulations to observe those extremely rare events. In physics, chemistry, and biology, rare event algorithms have recently been developed to compute probabilities of events that cannot be observed in direct numerical simulations. Here we propose such an algorithm, specifically designed for extreme heat or cold waves, based on statistical physics. This approach gives an improvement of more than two orders of magnitude in the sampling efficiency. We describe the dynamics of events that would not be observed otherwise. We show that European extreme heat waves are related to a global teleconnection pattern involving North America and Asia. This tool opens up a wide range of possible studies to quantitatively assess the impact of climate change.
Keywords: climate extremes; heat waves; large deviation theory; rare event algorithms; statistical physics.
Conflict of interest statement
The authors declare no conflict of interest.
Figures


References
-
- IPCC . Managing the Risks of Extreme Events and Disasters to Advance Climate Change Adaption: Special Report of the Intergovernmental Panel on Climate Change. Cambridge Univ Press; New York: 2012.
-
- AghaKouchak A. Extremes in a Changing Climate Detection, Analysis and Uncertainty. Springer; Dordrecht, The Netherlands: 2012.
-
- Herring SC, Hoerling MP, Peterson TC, Stott PA. 2014 Explaining extreme events of 2013 from a climate perspective. Available at http://www2.ametsoc.org/ams/assets/File/publications/BAMS_EEE_2013_Full_....
-
- IPCC . Contribution of Working Group I to the Fifth Assessment Report of the Intergovernmental Panel on Climate Change. Cambridge Univ Press; Cambridge, UK: 2013. Climate change 2013: The physical science basis.
-
- Coumou D, Rahmstorf S. A decade of weather extremes. Nat Clim Change. 2012;2:491–496.
Publication types
LinkOut - more resources
Full Text Sources
Other Literature Sources

