. 2018 Jan 9;115(2):415-420.
doi: 10.1073/pnas.1703601115. Epub 2017 Dec 19.

Generation of a whole-brain atlas for the cholinergic system and mesoscopic projectome analysis of basal forebrain cholinergic neurons

Affiliations

Generation of a whole-brain atlas for the cholinergic system and mesoscopic projectome analysis of basal forebrain cholinergic neurons

Xiangning Li et al. Proc Natl Acad Sci U S A. .

Abstract

The cholinergic system in the brain plays crucial roles in regulating sensory and motor functions as well as cognitive behaviors by modulating neuronal activity. Understanding the organization of the cholinergic system requires a complete map of cholinergic neurons and their axon arborizations throughout the entire brain at the level of single neurons. Here, we report a comprehensive whole-brain atlas of the cholinergic system originating from various cortical and subcortical regions of the mouse brain. Using genetically labeled cholinergic neurons together with whole-brain reconstruction of optical images at 2-μm resolution, we obtained quantification of the number and soma volume of cholinergic neurons in 22 brain areas. Furthermore, by reconstructing the complete axonal arbors of fluorescently labeled single neurons from a subregion of the basal forebrain at 1-μm resolution, we found that their projections to the forebrain and midbrain showed neuronal subgroups with distinct projection specificity and diverse arbor distribution within the same projection area. These results suggest the existence of distinct subtypes of cholinergic neurons that serve different regulatory functions in the brain and illustrate the usefulness of complete reconstruction of neuronal distribution and axon projections at the mesoscopic level.

Keywords: basal forebrain; cholinergic neurons; single neuron reconstruction; tomography; whole-brain imaging.


Conflict of interest statement

The authors declare no conflict of interest.

Figures

Fig. 1.
Fig. 1.
Generation of Chat-ires-Cre:Ai47 mice, experimental workflow, and analysis of expression specificity of Chat-ires-Cre:Ai47 mice. (A) Schematic diagram illustrating the generation of Chat-ires-Cre:Ai47 transgenic mice. Breeding germline-transmitted mice with the Rosa26-PhiC31 deletor line induced in vivo recombination between the AttB and AttP sites, with concomitant deletion of the intervening pPGK-neomycin selectable marker cassette to produce Ai47 mice. Breeding Ai47 mice with Chat-ires-Cre mice yielded Chat-ires-Cre:Ai47 mice, in which GFP is expressed specifically in ChAT-positive neurons. (B) Immunohistochemical analysis of expression specificity of Chat-ires-Cre:Ai47 mice. GFP and ChAT double-positive neurons, GFP-negative, and ChAT-positive neurons are indicated by arrows and arrowheads. (Scale bar: 100 μm.) (C) Colocalization of GFP and ChAT. Percentage of GFP-positive neurons expressing ChAT in different brain regions. (D) Labeling ratios of GFP-positive neurons to ChAT-positive neurons. Percentage of ChAT-positive neurons expressing GFP in different brain regions. Data in C and D are presented as the mean ± SEM; n = 30 slices from three mice for every brain region.
Fig. 2.
Fig. 2.
Quantitation of the distribution of cholinergic neurons in whole mouse brain. (A) Horizontal view of genetically labeled cholinergic neurons in the whole brain. Maximum-intensity projections were reconstructed at a resolution of 2 × 2 × 2 μm. Green points indicate GFP-positive cholinergic neurons. Scale bar represents distance from Bregma. A, anterior; D, dorsal; L, lateral; M, medial; P, posterior; V, ventral. (B) Merged image of coronal sections (GFP and PI signals) at the position indicated in A shows cholinergic neurons in the motor nucleus of trigeminal (V). (Scale bar: 500 μm.) (C) Overview of the 3D distribution of cholinergic neurons in V (Left). The neuron soma is distinguished using Imaris software and reconstructed in 3D space (Right). (Scale bar: 100 μm.) (D) Visualization of the anatomical localization and neuronal distribution of 3D-reconstructed subdivisions in midbrain and hindbrain. (E) Numbers of cholinergic neurons in brain regions of a single hemisphere [from five brains, one-way ANOVA, P < 0.0001, F (12, 104) = 59.99]. (F) Density of cholinergic neurons in midbrain and hindbrain of the single hemisphere shown in C [from five brains, one-way ANOVA, P < 0.0001, F (11, 88) = 12.79].
Fig. 3.
Fig. 3.
Mesoscopic projectome of cholinergic neurons in the basal forebrain. (A) The 3D view of cholinergic neurons in the MS/VDB labeled with AAV-CAG-FLEX-GFP virus. The resolution is 2 × 2 × 2 μm. (B) Diagram of the cholinergic projection from MS/VDB showing different routes to the olfactory bulb, frontal cortex, somatosensory cortex, hippocampal formation, and subcortical regions. Maximum-intensity projection of the coronal section showing the cholinergic terminals in mPFC (C), SSp (D), HPF (E), VISp (F), and ENTm (G). The length of the z stack is 100 μm. (H) A total of 50 cholinergic neurons were reconstructed from the whole-brain database. The soma of these reconstructed neurons focused in MS/VDB are shown in 3D. (I) Distribution of the 50 reconstructed neurons with their target areas. The numbers of neurons are labeled. (J) Schematic diagram illustrating the major projection patterns of the cholinergic neurons in VDB. The numbers of neurons are labeled. (Scale bar: 100 μm.)
Fig. 4.
Fig. 4.
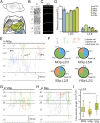
Illustration of cortical cholinergic neurons at single-cell resolution. (A) Cholinergic neurons distributed in the cortex, with the green points indicating the neurons. The flattened view of the mouse cortex in the reference atlas (18) showed the anatomical locations of the mPFC, MOp, MOs, SSp, and VISp. (B) Inverted image of the PI-staining figure showed the layer of the motor cortex. (C) The cholinergic neurons distributed in different layers of the motor cortex. (D) Percentage of cholinergic neurons in layer 2/3 and layer 4–6 of the mPFC, MOp, MOs, VISp, and SSp from five mice. (E) Reconstructed cholinergic neurons in the MOp exhibited bipolar cell (BPC), bitufted cell (BTC), and multipolar cell (MPC) patterns. (F) Statistical results showing various percentages of three morphological neurons distributed in the motor cortex, sensory cortex, and visual cortex (n = 63, 20, and 30, respectively). Reconstruction of cholinergic neurons in the SSp cortex (G) and VISp cortex (H). (I) The dendritic length of cholinergic neurons in layer 2/3 of the SSp cortex showed differences compared with those in the MOp and VISp cortices (unpaired t test, P = 0.0031, t = 3.066).

References

    1. Minces V, Pinto L, Dan Y, Chiba AA. Cholinergic shaping of neural correlations. Proc Natl Acad Sci USA. 2017;114:5725–5730. - PMC - PubMed
    1. Sarter M, Hasselmo ME, Bruno JP, Givens B. Unraveling the attentional functions of cortical cholinergic inputs: Interactions between signal-driven and cognitive modulation of signal detection. Brain Res Brain Res Rev. 2005;48:98–111. - PubMed
    1. Xu M, et al. Basal forebrain circuit for sleep-wake control. Nat Neurosci. 2015;18:1641–1647. - PMC - PubMed
    1. Szymusiak R. Magnocellular nuclei of the basal forebrain: Substrates of sleep and arousal regulation. Sleep. 1995;18:478–500. - PubMed
    1. Everitt BJ, Robbins TW. Central cholinergic systems and cognition. Annu Rev Psychol. 1997;48:649–684. - PubMed

Publication types

LinkOut - more resources