. 2017 Dec 19;8(1):1990.
doi: 10.1038/s41467-017-02119-6.

Systematic screening of generic drugs for progressive multiple sclerosis identifies clomipramine as a promising therapeutic

Affiliations

Systematic screening of generic drugs for progressive multiple sclerosis identifies clomipramine as a promising therapeutic

Simon Faissner et al. Nat Commun. .

Abstract

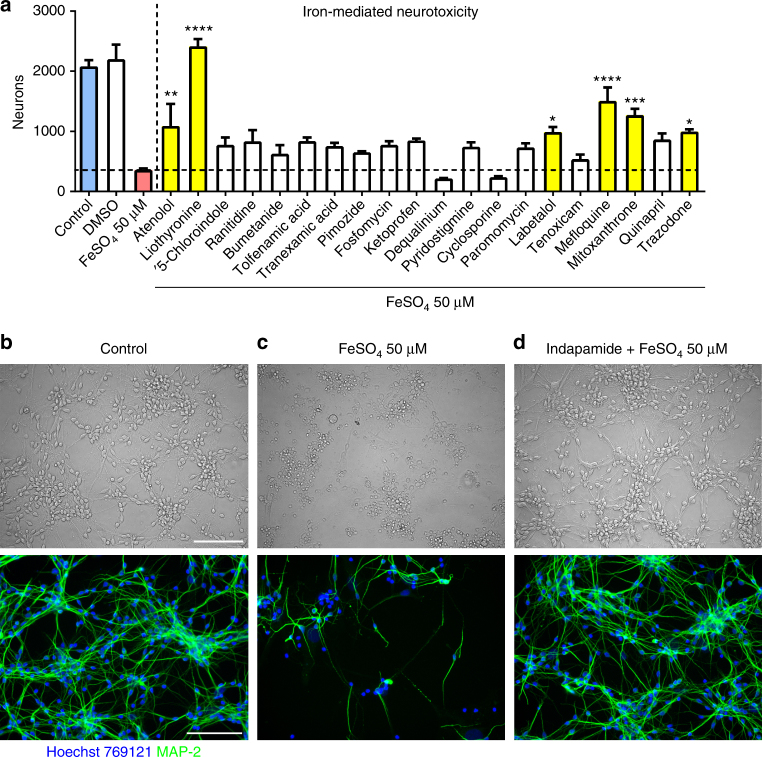
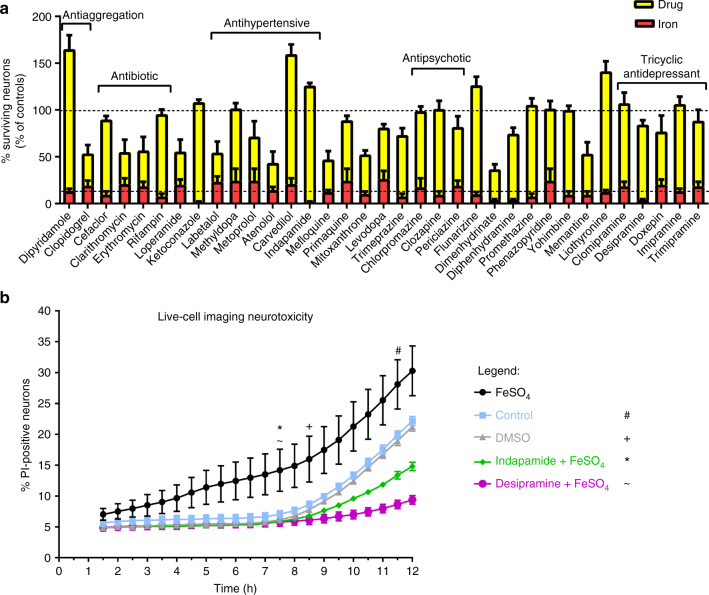
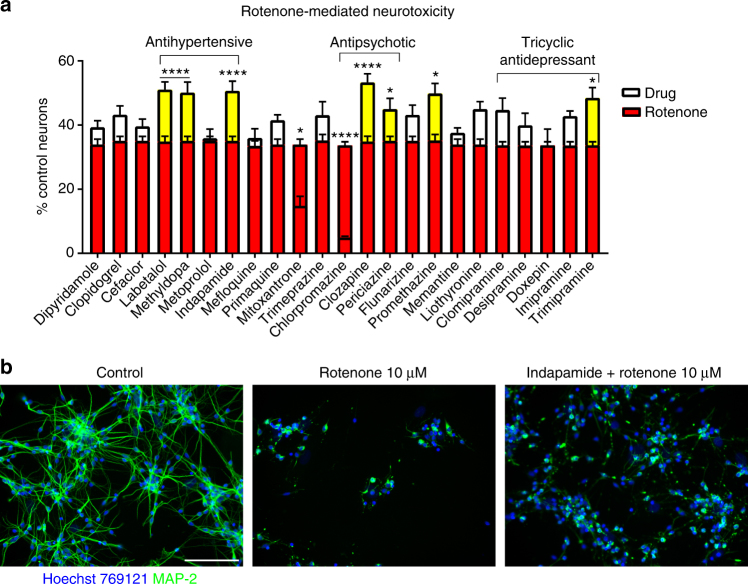
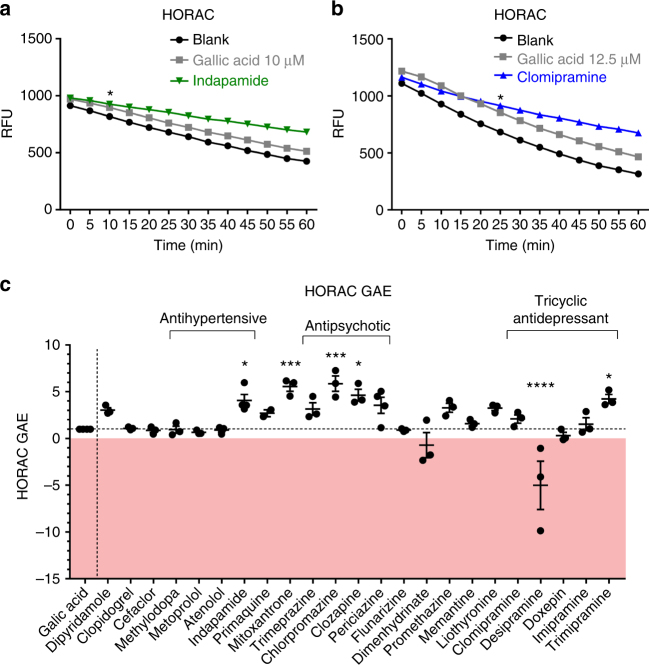
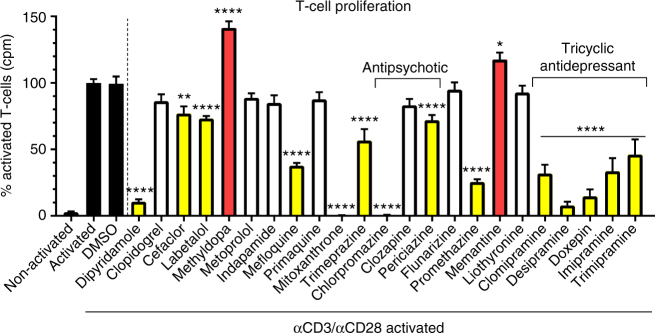
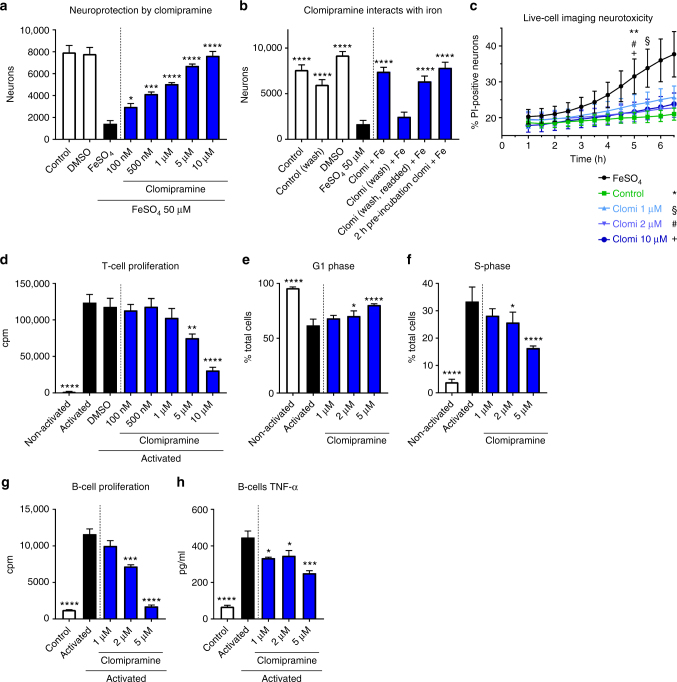
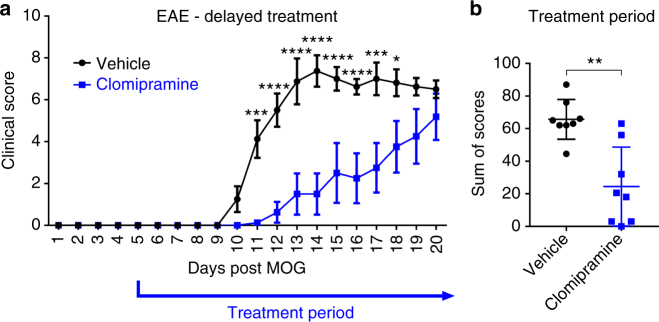
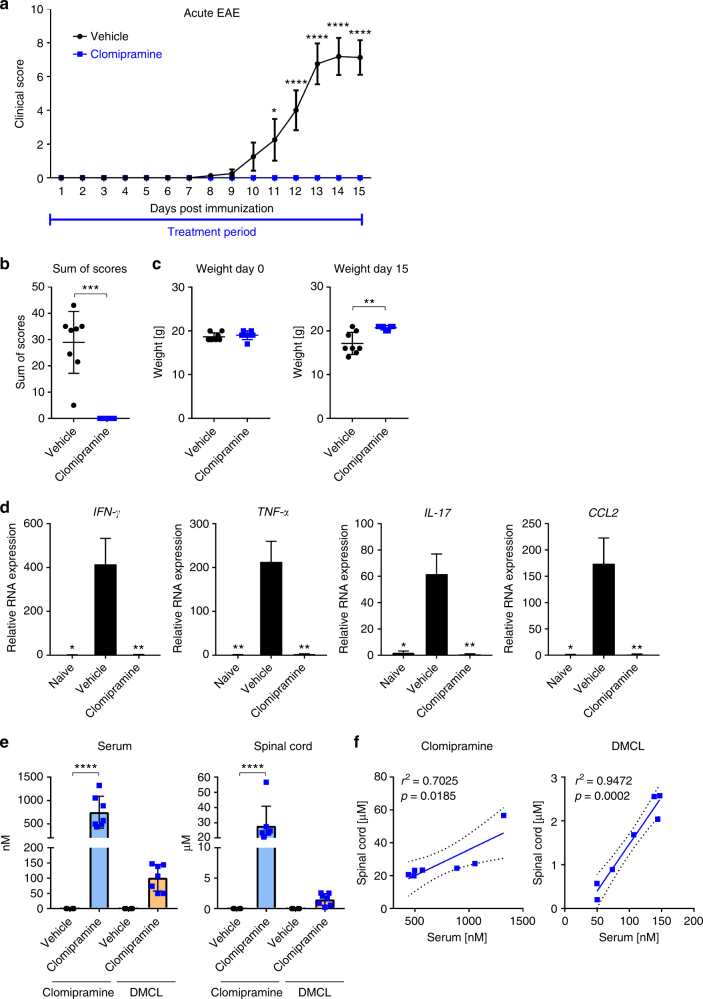
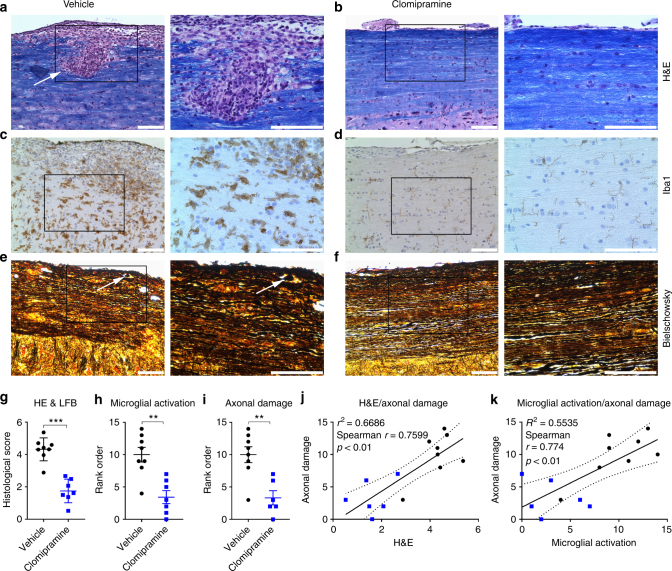
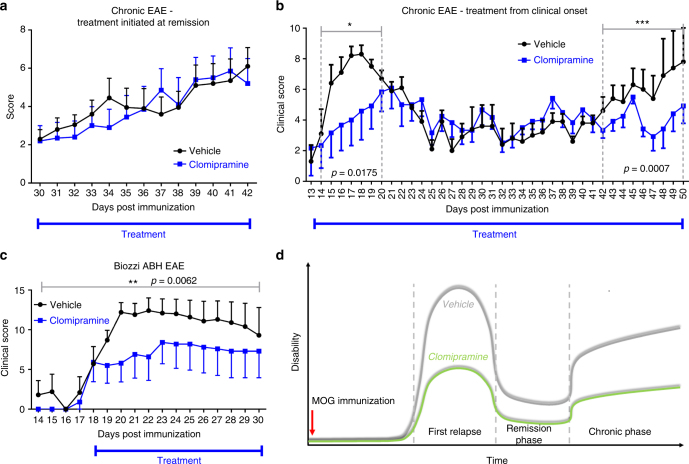
The treatment of progressive multiple sclerosis (MS) is unsatisfactory. One reason is that the drivers of disease, which include iron-mediated neurotoxicity, lymphocyte activity, and oxidative stress, are not simultaneously targeted. Here we present a systematic screen to identify generic, orally available medications that target features of progressive MS. Of 249 medications that cross the blood-brain barrier, 35 prevent iron-mediated neurotoxicity in culture. Of these, several antipsychotics and antidepressants strongly reduce T-cell proliferation and oxidative stress. We focus on the antidepressant clomipramine and found that it additionally inhibits B-lymphocyte activity. In mice with experimental autoimmune encephalomyelitis, a model of MS, clomipramine ameliorates clinical signs of acute and chronic phases. Histologically, clomipramine reduces inflammation and microglial activation, and preserves axonal integrity. In summary, we present a systematic approach to identify generic medications for progressive multiple sclerosis with the potential to advance rapidly into clinical trials, and we highlight clomipramine for further development.


Conflict of interest statement

S.F., M.K., and V.W.Y. filed a provisional patent application at the US FDA. The remaining authors declare no competing financial interests.

Figures

Fig. 1
Fig. 1
Screening of generic compounds to prevent iron-mediated neurotoxicity. Shown is an example of a screening of drugs to identify those that prevent iron-mediated neurotoxicity to human neurons. Neurons were pretreated with drugs at a concentration of 10 µM, followed by a challenge with 25 or 50 µM FeSO4 after 1 h. In this experiment, several compounds (yellow bars) prevented against iron-mediated neurotoxicity as determined by the number of survival neurons in automated counts after 24 h (a). Values in a are mean ± SEM of n = 4 wells per condition. One-way analysis of variance (ANOVA) with Bonferroni post hoc analysis vs. iron: *p < 0.05; **p < 0.01; ***p < 0.001; ****p < 0.0001. bd Representative images show the untreated control and iron-treated neurons, as well as the prevention of neurotoxicity by indapamide (top: bright field; bottom: fluorescence microscopy). Neurons were detected by anti-MAP-2 antibody. The scale bars depict 100 µm
Fig. 2
Fig. 2
Summary of compounds that attenuate iron-mediated neurotoxicity. Shown are all 35 generic drugs that prevent iron-mediated neurotoxicity (a). The number of neurons in each well of a given experiment was normalized to the number of neurons of the respective untreated control condition (100%). The corresponding FeSO4-treated condition (red) was also normalized to the respective control. Some of the major drug classes are depicted in the figure. Shown are the mean ± SEM of 2–4 independent experiments, performed in quadruplicates (thus, 8–16 wells per treatment across experiments are depicted in the figure). b shows the results from live-cell imaging of neurons (see examples in Supplementary Video 1), challenged with FeSO4 in a concentration of 50 µM. Upon pre-treatment with indapamide or desipramine 1 h before the addition of iron, the number of propidium iodide-positive cells was significantly reduced after 7.5 h and even below the level of the untreated control condition after 12 h, suggesting a strong neuroprotective effect. Live-cell imaging was performed over 12 h, where images were taken every 30 min. The time-point from which significant changes from FeSO4 were observed for each group is marked with a symbol (# control; + DMSO; * indapamide; ~ desipramine). Shown are means ± SEM of n = 3 wells per condition. Results were analyzed with a two-way ANOVA with Dunnett's multiple comparison as post hoc analysis
Fig. 3
Fig. 3
Prevention of mitochondrial damage induced by rotenone. Some of the generic drugs that prevented against iron-mediated neurotoxicity were tested against mitochondrial damage to neurons. Some compounds, such as indapamide, prevented mitochondrial damage as shown after normalization to the control neurons (a). However, the rescue effect was small. Treatment with rotenone induced marked morphological changes with retraction of cell processes (b). The scale bar shows 100 µM. Shown are normalized data of mean ± SEM of 1–3 experiments each performed in quadruplicates. Two-way ANOVA with Bonferroni multiple comparisons test as post hoc analysis vs. rotenone: *p < 0.05; ****p < 0.0001
Fig. 4
Fig. 4
Scavenging of hydroxyl radicals in a biochemical assay. The antioxidative capacities of selected compounds that reduced iron-mediated neurotoxicity were analyzed using the HORAC assay. a shows a representative experiment depicting the decay of relative fluorescence units over 60 min for indapamide, gallic acid (GA) and the control (blank). b The upward shift of the curve for clomipramine in the HORAC assay indicates an antioxidative effect that is even stronger than gallic acid. HORAC gallic acid equivalents (GAEs) were calculated by the integration of the area under the curve of the decay of fluorescence of the test compound over 60 min in comparison to 12.5 µM gallic acid and blank. Shown are data of n = 3–4 independent experiments ±SEM, with each experiment performed in triplicates (c). The antipsychotics showed strong antioxidative effects, as demonstrated with HORAC GAEs of >3. Data points >1 represent antioxidative capacity (the gallic acid effect is 1), 0 represents no antioxidative properties, and data <0 show pro-oxidative effect. Two-way ANOVA with Dunnett's multiple comparisons test as post hoc analysis (a, b); the first significant time point vs. gallic acid is depicted as asterisk. One-way ANOVA with Dunnett's multiple comparisons test as post hoc analysis vs. gallic acid (c). *p < 0.05; **p < 0.01; ***p < 0.001; ****p < 0.0001. RFU relative fluorescence units
Fig. 5
Fig. 5
Effects on proliferation of T-lymphocytes. The tricyclic antidepressants (clomipramine, desipramine, imipramine, trimipramine, and doxepin) reduced proliferation of T-cells markedly (p < 0.0001). Data were normalized to counts per minute (cpm) of activated control T-cells. Shown are data pooled from two independent experiments each performed in quadruplicates. Data are depicted as mean ± SEM. One-way ANOVA with Dunnett's multiple comparisons test as post hoc analysis compared to activated splenocytes. *p < 0.05; **p < 0.01; ****p < 0.0001
Fig. 6
Fig. 6
Clomipramine reduces iron neurotoxicity and proliferation of T-lymphocytes and B-lymphocytes. Clomipramine attenuated iron-mediated neurotoxicity in a concentration-dependent manner from 100 nM (p < 0.05) (a). Washing away clomipramine led to cell death by iron, but this effect could be prevented after pre-incubation of clomipramine with iron, suggesting a physical reaction between clomipramine and iron (b). Live-cell imaging studies show that the increasing accumulation of PI-positive neurons exposed to iron over time was prevented by clomipramine (c). Clomipramine furthermore reduced the proliferation of T-lymphocytes (d), reflected by a reduction of cells in S-phase and an increase in the G1-phase of the cell cycle (e, f). Proliferation of activated B-cells was reduced by clomipramine from 2 µM (g), correspondent with reduced TNF-α release (h). Data are shown as quadruplicate replicate wells of an individual experiment that was conducted twice (a, d, e, f), once (b) or three times (g, h); c represents triplicate wells of one experiment. Results are mean ± SEM. One-way ANOVA with Dunnett's multiple comparisons test as post hoc analysis compared to the FeSO4 or activated condition (a, b, dh) and two-way ANOVA with Dunnett's multiple comparisons test (c): *p < 0.05; **p < 0.01; ***p < 0.001; ****p < 0.0001
Fig. 7
Fig. 7
Clomipramine initiated from day 5 delays the onset of EAE clinical disease. Female C57BL/6 mice (age 8–10 weeks) were treated with clomipramine IP (25 mg/kg) or PBS (vehicle) from day 5 after induction of MOG-EAE (a). The disease onset was delayed and from day 11 the clinical course differed significantly (p < 0.001). Eventually, clomipramine-treated mice also developed the same disease burden as vehicle-treated mice. The overall disease burden is shown in (b). n = 8 vehicle and n = 8 clomipramine EAE mice. Data are depicted as mean ± SEM. Two-way ANOVA with Sidak's multiple-comparisons test as post hoc analysis (a) and two-tailed unpaired non-parametric Mann–Whitney test (b). Significance is shown as *p < 0.05; **p < 0.01; ***p < 0.001; ****p < 0.0001
Fig. 8
Fig. 8
Early clomipramine treatment suppressed EAE disease activity. Female C57BL/6 mice (age 8–10 weeks) were treated with clomipramine IP (25 mg/kg) or PBS (vehicle) from the day of induction of MOG-EAE (day 0). From day 11 the clinical course differed significantly (p < 0.05); while vehicle-treated mice accumulated progressive disability, clomipramine-treated mice remained unaffected even up to the termination of the experiment when vehicle-treated mice were at peak clinical severity (paralysis or paresis of tail and hind limb functions and paresis of forelimbs) (a). The overall burden of disease per mouse was plotted in b, while the relative weight of mice, reflecting general health, is shown in c. In the lumbar cord at animal sacrifice (day 15), there was a significant upregulation in vehicle-EAE mice of transcripts encoding Ifng, Tnfa, Il-17, and Ccl2 compared to naïve mice, whereas clomipramine-treated mice did not show these elevations (d). Levels of clomipramine and the active metabolite desmethylclomipramine in serum and spinal cord at sacrifice (e) are consistent to concentrations reached in humans. There was a strong correlation of serum levels of clomipramine and desmethylclomipramine with spinal cord levels (f). Data in d are RT-PCR results, with values normalized to Gapdh as housekeeping gene and expressed in relation to levels in naïve mice. n  = 8 vehicle and n = 7 clomipramine EAE mice. Data are depicted as mean ± SEM. Two-way ANOVA with Sidak's multiple-comparisons test as post hoc analysis (a), two-tailed unpaired non-parametric Mann–Whitney test (b), two-tailed unpaired t-test (c, e, f), and one-way ANOVA with Tukey's multiple comparisons test as post hoc analysis (d). Correlations were calculated using a linear regression model, dotted lines show the 95% confidence interval (f). Significance is shown as *p < 0.05; **p < 0.01; ***p < 0.001; ****p < 0.0001
Fig. 9
Fig. 9
Reduced inflammation and axonal damage upon clomipramine treatment. Vehicle-treated animals had marked parenchymal inflammation, indicated by an arrow (a), whereas clomipramine-treated animals only had low meningeal inflammation (b). This was reflected in better histological scores (g) evaluated by a previously described method (a, b: Hematoxylin/eosin and luxol fast blue, HE and LFB). Vehicle-treated animals had pronounced microglial activation (Iba1 stain, c), which was accompanied by axonal damage with formation of axonal bulbs (indicated by an arrow, Bielschowsky stain, e). Clomipramine treatment reduced microglial activation concomitant with preserved axonal integrity (d, f). This was reflected in a blinded rank order analysis (h, i). Infiltration and microglial activation positively correlated with axonal damage (j, k). c/e and d/f are adjacent sections. Images are shown in 20-times and 40-times original magnification. The scale bars show 100 µm. Non-parametric two-tailed Mann–Whitney test (gi) and non-parametric two-tailed Spearman correlation with 95% confidence interval (j, k). Significance is shown as **p < 0.01; ***p < 0.001
Fig. 10
Fig. 10
Clomipramine improves the chronic phase of EAE. a Female C57BL/6 (age 8–10 weeks) MOG-immunized mice were treated with clomipramine IP (25 mg/kg) or PBS (vehicle) from remission after the first relapse, and this did not affect disease score between the groups (n = 10 vehicle, n = 10 clomipramine). b In a second experiment, MOG-immunized C57BL/6 mice were treated from onset of clinical signs. Here, clomipramine reduced the clinical severity of the first relapse (day 14–20, p = 0.0175, two-tailed Mann–Whitney t-test) and of the second relapse at the late chronic phase (day 42–50, p = 0.0007, two-tailed Mann–Whitney t-test) (n = 5 vehicle, n = 6 clomipramine). Note that an initial two-way ANOVA with Sidak's multiple-comparisons test of the experiment from day 13–50 was not statistically significant, since vehicle-treated mice spontaneously remitted to a very low disease score between days 25 and 42, so that differences with the treatment group could not be detected. Hence, we analyzed differences of the acute and chronic relapse phases outside of the period of remission, using Mann–Whitney t-test. c Using Biozzi ABH mice, treatment from onset of clinical disability showed a positive effect on the chronic phase (p = 0.0062, two-tailed Mann–Whitney test) (n = 5 vehicle, n = 5 clomipramine). When a two-way ANOVA with Sidak's multiple-comparisons test was used, the results were not significant since the individual variability of mice in either group in any given day was very high for this model in our hands. d A summary of the effect of clomipramine when treatment is initiated at the onset of clinical signs

References

    1. Ransohoff RM, Hafler DA, Lucchinetti CF. Multiple sclerosis—a quiet revolution. Nat. Rev. Neurol. 2015;11:134–142. doi: 10.1038/nrneurol.2015.14. - DOI - PMC - PubMed
    1. Lublin F, et al. Oral fingolimod in primary progressive multiple sclerosis (INFORMS): a phase 3, randomised, double-blind, placebo-controlled trial. Lancet. 2016;387:1075–1084. doi: 10.1016/S0140-6736(15)01314-8. - DOI - PubMed
    1. Montalban X, et al. Ocrelizumab vs. placebo in primary progressive multiple sclerosis. New Engl. J. Med. 2017;376:209–220. doi: 10.1056/NEJMoa1606468. - DOI - PubMed
    1. Kappos L. et al. Efficacy and safety of siponimod in secondary progressive multiple sclerosis—results of the placebo controlled, double-blind, Phase III EXPAND study. ECTRIMS Online Library (2016).
    1. Lassmann H, van Horssen J, Mahad D. Progressive multiple sclerosis: pathology and pathogenesis. Nat. Rev. Neurol. 2012;8:647–656. doi: 10.1038/nrneurol.2012.168. - DOI - PubMed

Publication types

MeSH terms