. 2017 Dec 19;8(1):2184.
doi: 10.1038/s41467-017-02292-8.

Extensive gene content variation in the Brachypodium distachyon pan-genome correlates with population structure

Affiliations

Extensive gene content variation in the Brachypodium distachyon pan-genome correlates with population structure

Sean P Gordon et al. Nat Commun. .

Abstract

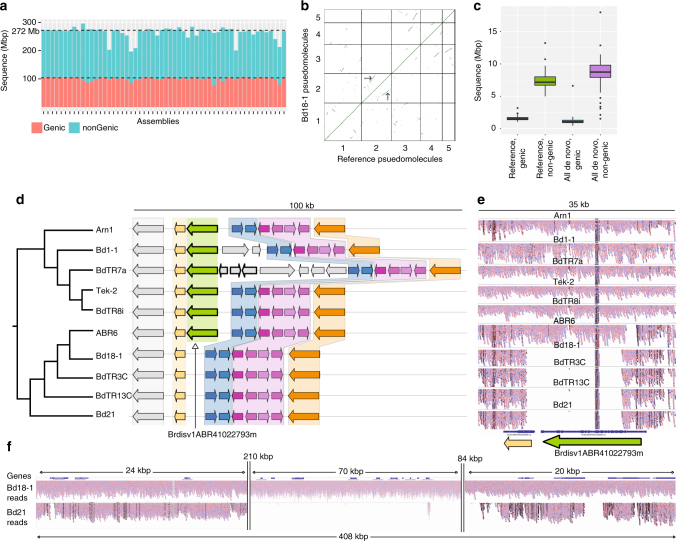
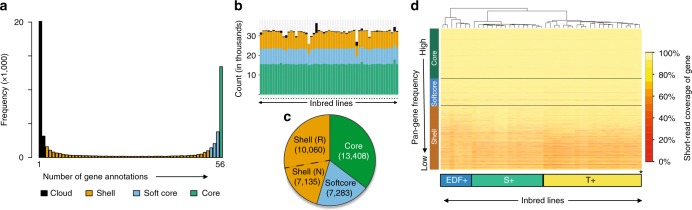
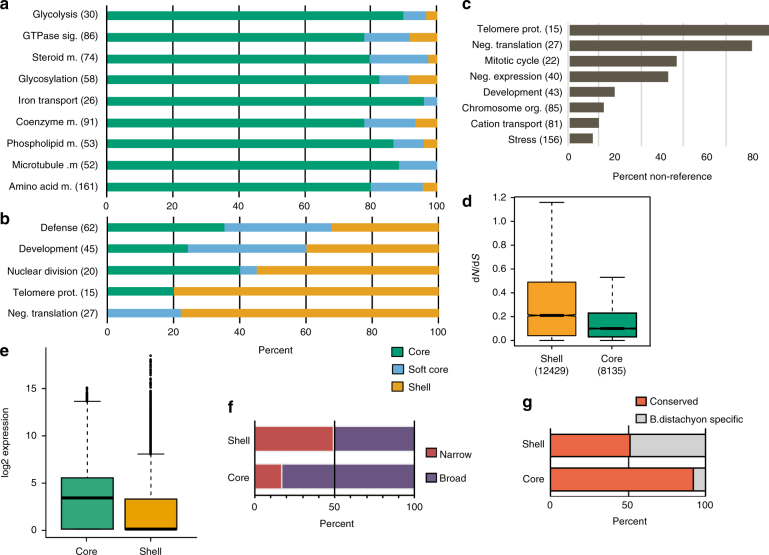
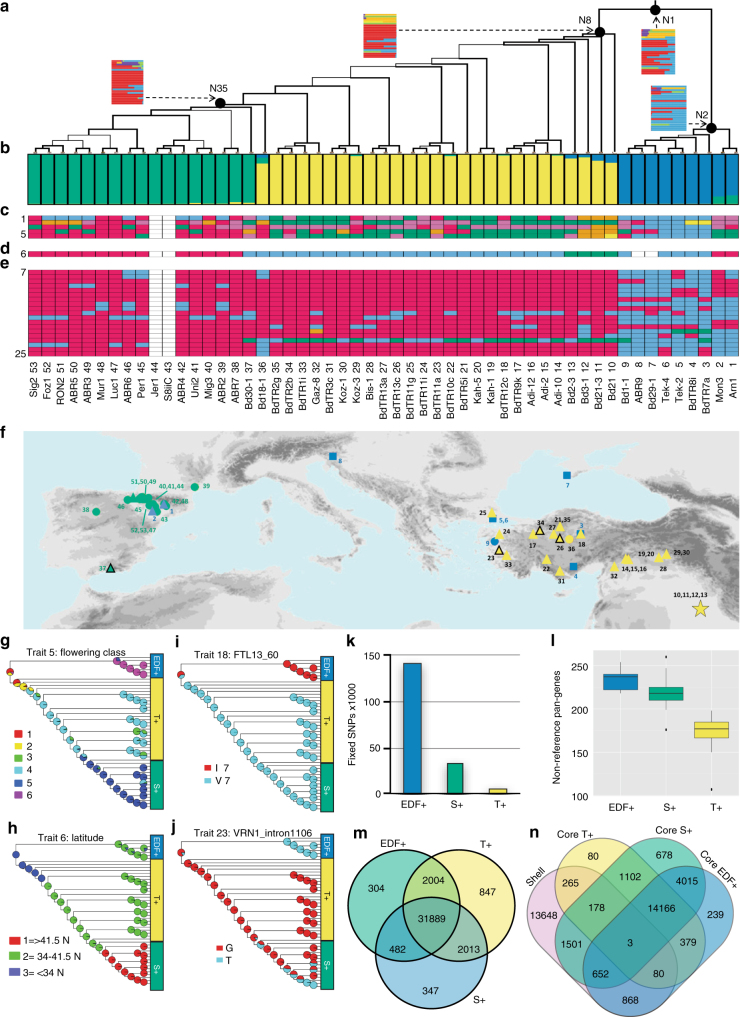
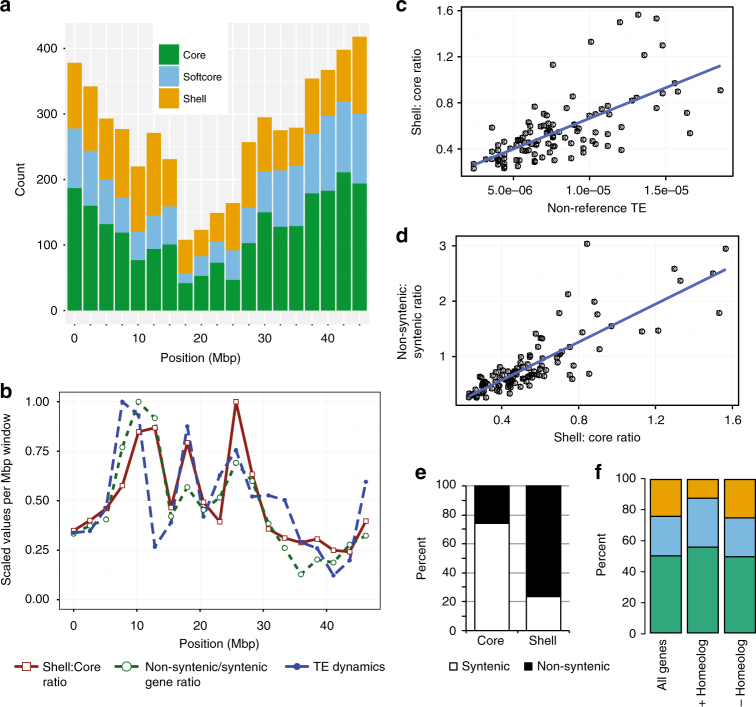
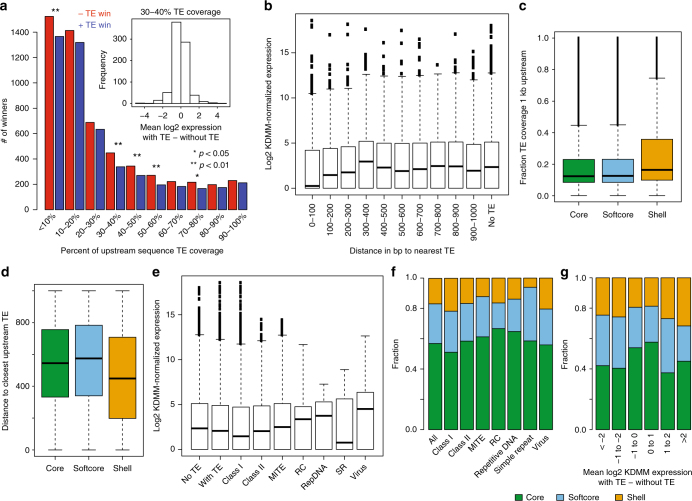
While prokaryotic pan-genomes have been shown to contain many more genes than any individual organism, the prevalence and functional significance of differentially present genes in eukaryotes remains poorly understood. Whole-genome de novo assembly and annotation of 54 lines of the grass Brachypodium distachyon yield a pan-genome containing nearly twice the number of genes found in any individual genome. Genes present in all lines are enriched for essential biological functions, while genes present in only some lines are enriched for conditionally beneficial functions (e.g., defense and development), display faster evolutionary rates, lie closer to transposable elements and are less likely to be syntenic with orthologous genes in other grasses. Our data suggest that differentially present genes contribute substantially to phenotypic variation within a eukaryote species, these genes have a major influence in population genetics, and transposable elements play a key role in pan-genome evolution.


Conflict of interest statement

The authors declare no competing financial interests.

Figures

Fig. 1
Fig. 1
Genome assembly and analysis. a Genome assembly size and coding sequence for all lines. Dashed lines correspond to the reference genome size and amount of coding (red) and non-coding (blue) sequence. See Supplementary Table 2 for line names and assembly statistics. b Dotplot of syntenic genes between Bd18-1 scaffolds and the reference genome. Note that the short syntenic segments (one example indicated by arrows) off the main diagonal line are signatures of an ancient whole-genome duplication. These short segments are apparent even when comparing the reference genome to itself and are not assembly artifacts. c Similar amounts of coding and non-coding sequence are estimated to be absent in each line, measured by coverage of short reads from respective lines to the reference genome sequence, or alignment of reference short reads to respective de novo assemblies. Whiskers show data within 1.5 times the interquartile range (IQR). d Syntenic representation of the locus contining the non-reference pan-gene BrdisvABR41022793m. Note that the pan-gene is present in the top six genomes but absent from the bottom four, including the reference genome (Bd21). e Short reads from the lines in d mapped to the BdTR8i genome. Note that read mapping supports the presence/absence of BrdisvABR41022793m. f Short reads from Bd21 and Bd18-1 mapped to the Bd18-1 genome in a region where Bd18-1 contains 408 kb of sequence that is extremely diverged or absent from the reference genome (between the relatively conserved left and right flanking regions). Note that the interval contains multiple annotated genes
Fig. 2
Fig. 2
Gene-based pan-genome. Annotated genes (genomic sequence) from all genomes were clustered, and a single representative from each cluster was selected to create a gene-based pan-genome. a Number of pan-gene clusters represented within respective numbers of inbred line annotations. b Number of core, softcore, shell, and cloud pan-genes for individual inbred lines. c Number of core, softcore, and shell pan-genes in the high-confidence pan-genome. Shell pan-genes are divided into reference (R) and non-reference (N). d Percent coverage of 37,886 high-confidence pan-genes by short read data sets from 49 lines. Color-coded bars on the lower axis indicate the population groups described in Fig. 4; pan-genome categories are labeled on the vertical axis. Note that short read coverage supports the classification of the pan-genome compartments and that the clustering of lines by short read coverage matches the population groups identified in Fig. 4
Fig. 3
Fig. 3
Functional classification of pan-gene categories. Gene Ontology (GO) biological process categories enriched in the core a and shell b pan-gene subsets, showing the distribution of all genes in that category across the pan-genome. Note that the “neg. (negative) translation” category includes defensive peptides that inhibit translation. c Percent of respective GO biological process categories comprised of non-reference genes. Total number of genes in each category is listed after the category label on the y axis. d The ratio of non-synonymous to synonymous mutations indicates that shell genes are evolving faster than core genes within B. distachyon (p < 2.2e−16, t-test). e Core genes are expressed at higher levels than shell genes (p < 2.2e-16, Wilcoxon signed rank). f Core genes are more broadly expressed within multiple tissues than shell genes and g are more likely to be identified as conserved in rice or sorghum. Whiskers in the above plots extend to the most extreme data point which is no more than 1.5 times the IQR
Fig. 4
Fig. 4
Populations analysis. a Maximum likelihood phylogenetic tree based on 3,933,264 SNPs for 53 B. distachyon lines. Thickness of branches indicates bootstrap support (thick, 100%; intermediate, 70–99%; thin, 50–69%). Insets at select nodes (N) show the probabilities for the ancestral state of the traits in c and e. b Plot of individual membership (SNP profiles) to optimal K = 3 Bayesian STRUCTURE groups: EDF+ (blue), T+ (yellow), S+ (green) (see Supplementary Table 3). c–e Color-coded matrix based on mapping all trait values to discrete state categories for flowering phenotypes (c), collection site latitude (d), and DNA variants in known flowering genes (e). Color labels can be found in Supplementary Table 4. f Geographic distribution of accessions. Points labeled as: Extremely Delayed Flowering (EDF+): square; Delayed Flowering (DF): circle; Intermediate Delayed Flowering (IDF): triangle; Intermediate Rapid Flowering (IRF): open triangle; Rapid Flowering (RF) and Extremely Rapid Flowering (ERF): star. Colors reflect membership to STRUCTURE groups in b. The background map was constructed from Worldclim (http://www.worldclim.org/) elevation date using ArcGIS software (http://www.esri.com/arcgis). g–j ML mapping of probable ancestral states for g flowering time class, h latitude, i molecular variant in the FLT13 gene, and j molecular variant in the known flowering regulator VRN1. See Supplementary Fig. 5 and 6a for individual line labels and the remaining traits, respectively. k Fixed-SNP differences between the three STRUCTURE groups. l Median number of non-reference genes added per line from each of the three major groups. m Exclusive and shared gene clusters between the three STRUCTURE groups (including admixed lines). n, Overlap between core pan-genes in sub-population pan-genomes from the three STRUCTURE groups (without admixed lines) and shell genes in the combined pan-genome. Whiskers in the above plots extend to the most extreme data point which is no more than 1.5 times the IQR
Fig. 5
Fig. 5
Chromosomal characterization of pan-gene subsets. a Number of reference genes in respective pan-genome categories within 2.5 Mbp windows along chromosome 4. b Shell:Core gene ratio, non-syntenic:syntenic gene ratio (in comparison to rice, Oryza sativa), and the number of reference TEs absent from other B. distachyon lines compared to the reference (a measure of TE dynamics), plotted for 2.5 Mbp non-overlapping windows along chromosome 4. Frequency of TE “insertion” relative to the reference genome shows a similar pattern as TE “absence” (Supplementary Fig. 9). c Intra-species TE insertion frequency vs. shell:core gene ratio within 2.5 Mbp genomic intervals. d Plot of non-syntenic:syntenic gene ratio vs. shell:core gene ratio. e Percent of core and shell genes in the reference genome that are/are not syntenic with the corresponding rice ortholog. f Fewer shell genes in the reference genome have a homeolog that was retained after the ancient grass whole-genome duplication
Fig. 6
Fig. 6
Effect of TE insertions on gene expression. a Number of winners in binomial distribution sign tests (horserace comparisons) of expression level among alleles with/without TEs, p-values based on a binomial test. Inset shows log2 expression differences between alleles with/without TEs, for focused comparisons of alleles having 30–40% TE coverage. b Expression level of genes with TE within specified distance to the translation start site. c, Fraction of TE coverage of 1 kbp upstream of core, softcore, and shell subsets. d Distance to closest upstream TE for core, softcore, and shell subsets. e Expression level of genes adjacent to respective TE classes. f Percent of genes adjacent to repeats of respective classes assigned as core, softcore, and shell categories. g Genes binned according to mean log2 expression difference between alleles of a gene with/without TEs, each colored according to membership in core, softcore, and shell categories. Whiskers in the above plots extend to the most extreme data point which is no more than 1.5 times the IQR

References

    1. Hufford MB, et al. Comparative population genomics of maize domestication and improvement. Nat. Genet. 2012;44:808–811. doi: 10.1038/ng.2309. - DOI - PMC - PubMed
    1. Shomura A, et al. Deletion in a gene associated with grain size increased yields during rice domestication. Nat. Genet. 2008;40:1023–1028. doi: 10.1038/ng.169. - DOI - PubMed
    1. Xu K, et al. Sub1A is an ethylene-response-factor-like gene that confers submergence tolerance to rice. Nature. 2006;442:705–708. doi: 10.1038/nature04920. - DOI - PubMed
    1. Ashikawa I, et al. Two adjacent nucleotide-binding site-leucine-rich repeat class genes are required to confer Pikm-specific rice blast resistance. Genetics. 2008;180:2267–2276. doi: 10.1534/genetics.108.095034. - DOI - PMC - PubMed
    1. Yao W, et al. Exploring the rice dispensable genome using a metagenome-like assembly strategy. Genome Biol. 2015;16:187. doi: 10.1186/s13059-015-0757-3. - DOI - PMC - PubMed

Publication types

MeSH terms

Substances