Comparative Study
. 2017 Dec 19;8(1):2193.
doi: 10.1038/s41467-017-02320-7.

Mutational patterns in chemotherapy resistant muscle-invasive bladder cancer

Affiliations
Comparative Study

Mutational patterns in chemotherapy resistant muscle-invasive bladder cancer

David Liu et al. Nat Commun. .

Abstract

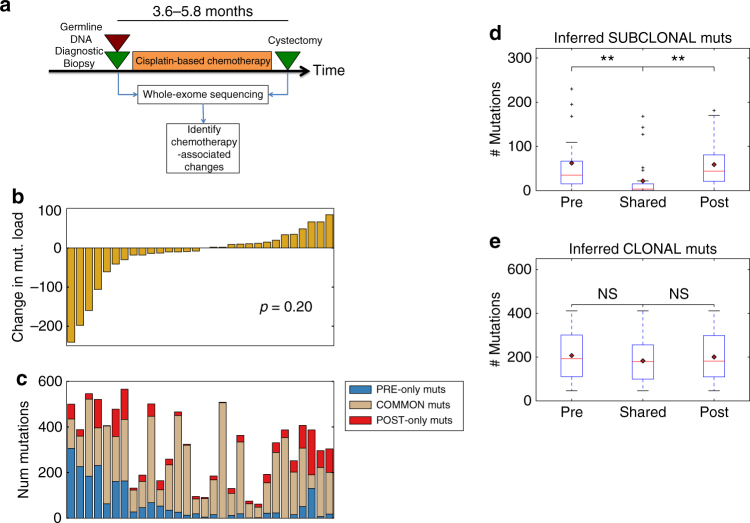
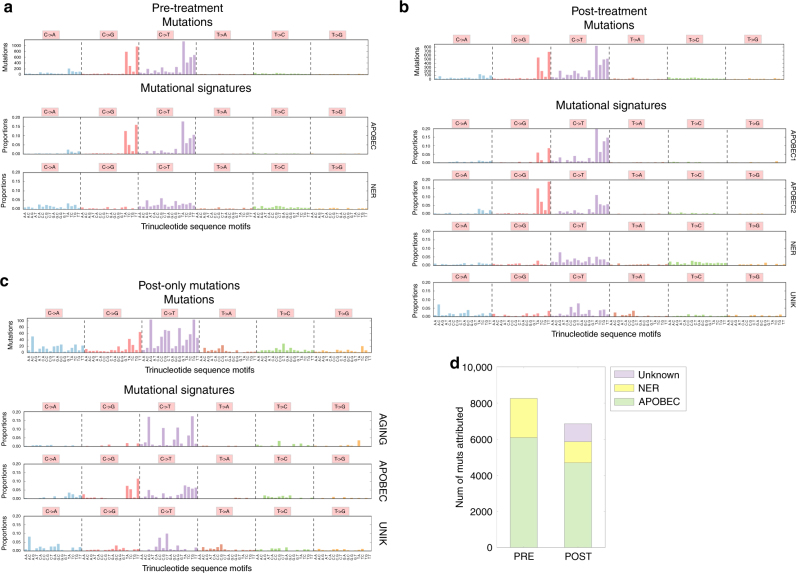
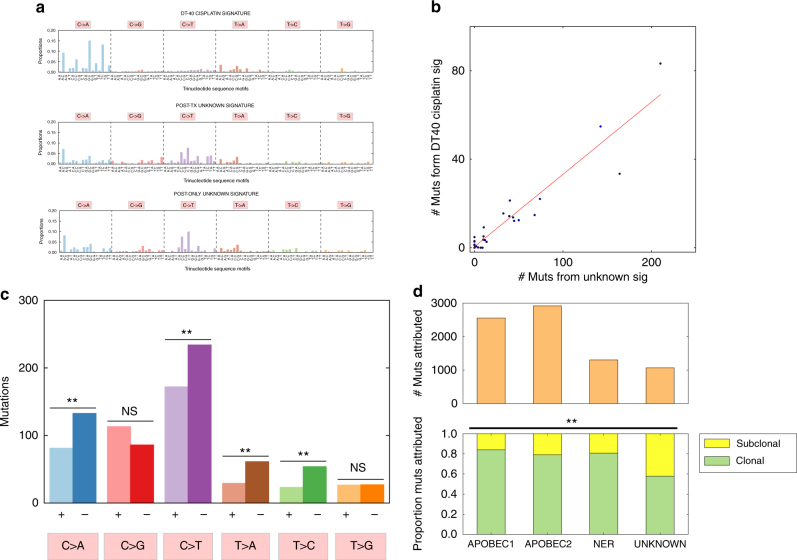
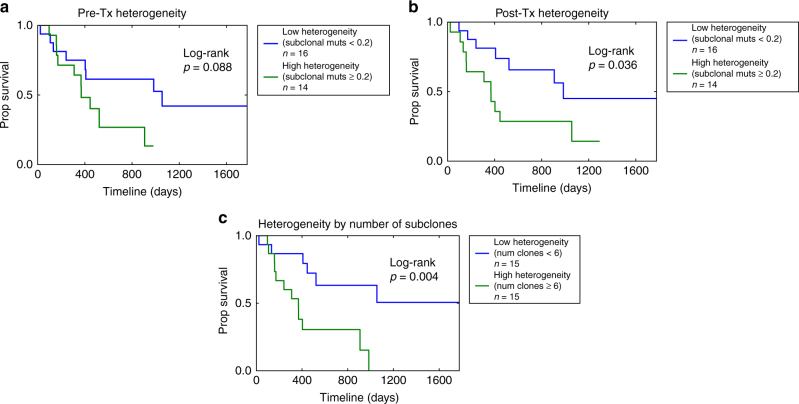
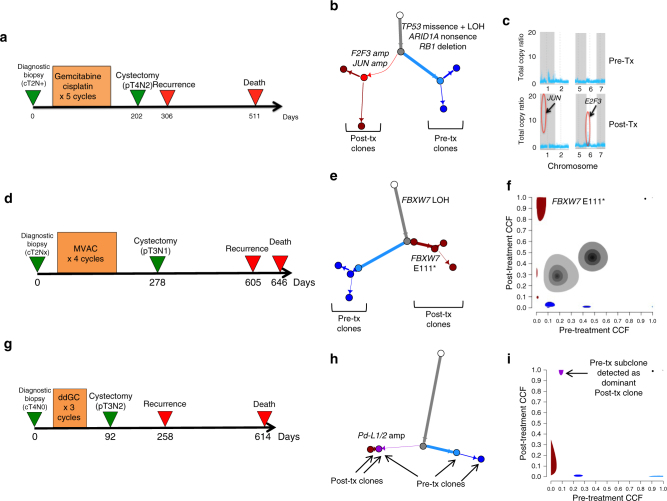
Despite continued widespread use, the genomic effects of cisplatin-based chemotherapy and implications for subsequent treatment are incompletely characterized. Here, we analyze whole exome sequencing of matched pre- and post-neoadjuvant cisplatin-based chemotherapy primary bladder tumor samples from 30 muscle-invasive bladder cancer patients. We observe no overall increase in tumor mutational burden post-chemotherapy, though a significant proportion of subclonal mutations are unique to the matched pre- or post-treatment tumor, suggesting chemotherapy-induced and/or spatial heterogeneity. We subsequently identify and validate a novel mutational signature in post-treatment tumors consistent with known characteristics of cisplatin damage and repair. We find that post-treatment tumor heterogeneity predicts worse overall survival, and further observe alterations in cell-cycle and immune checkpoint regulation genes in post-treatment tumors. These results provide insight into the clinical and genomic dynamics of tumor evolution with cisplatin-based chemotherapy, suggest mechanisms of clinical resistance, and inform development of clinically relevant biomarkers and trials of combination therapies.


Conflict of interest statement

The authors declare no competing financial interests.

Figures

Fig. 1
Fig. 1
Overall chemotherapy associated changes in genomic alterations. a Schematic overview of tumor tissue collection in the context of neoadjuvant cisplatin-based chemotherapy, followed by whole-exome sequencing and analysis. The 25th to 75th percentile time between diagnosis and cystectomy samples was 3.6–5.8 months. b Inferred changes in mutational load per patient from pre-treatment to post-treatment. Overall, there is no statistically significant change in the total mutational load (mean change = −17.3, paired t-test p = 0.20). c Breakdown of mutations private to the pre-treatment tumor, post-treatment tumor, and common to both. The mean number of “pre-only” mutations (private to pre-treatment tumor) and “post-only” mutations (private to post-treatment tumor) mutations is 64.7 (SD = 81.1) and 47.5 (SD = 46.9), respectively. d Boxplot of pre-treatment, shared, and post-treatment subclonal mutations. There are almost no shared subclonal mutations (median 3.5 mutations, 25th–75th percentile 1–15 mutations). There is a statistically significant difference between the number of inferred subclonal pre-treatment and shared, and shared and post-treatment mutations (Mann–Whitney U p = 1.2e-04, p = 1.9e-05 respectively). e Boxplot of pre-treatment, shared, and post-treatment clonal mutations. There is no statistically significant difference between the number of inferred clonal mutations in the pre-treatment tumors and shared between pre and post-treatment tumors, and shared mutations and post-treatment mutations (Mann–Whitney U p = 0.38, p = 0.51). SD Standard Deviation, N.S. Not statistically significant; “*”Indicates p < 0.05; “**”Indicates p < 0.01
Fig. 2
Fig. 2
Mutations and mutational signatures in pre- and post-treatment tumors. a Mutations and mutational signatures in pre-treatment tumors. The top bar graph shows the number of mutations per trinucleotide sequence motif across all pre-treatment tumors. The bottom two bar graph shows the mutational signatures inferred in pre-treatment tumors. Two mutational signatures, matching previously described mutational signatures associated with APOBEC activity (cos sim = 0.99 with average of COSMIC Sig 2 and 13, = 0.82 with each individually), and nucleotide excision repair (NER) deficit (cos sim = 0.91 with COSMIC 5), were discovered. The NER signature also appears to have the aging signature embedded at a low level, which our data is unable to resolve. a Mutations and mutational signatures in post-treatment tumors. The top bar graph shows the number of mutations per trinucleotide sequence motif across all post-treatment tumors. The bottom bar graphs show the mutational signatures inferred in post-treatment tumors. Four mutational signatures were discovered, with three matching previously described signatures (APOBEC1: cos sim = 0.96 with COSMIC Sig 2; APOBEC2: cos sim = 0.95 with COSMIC Sig 13; NER: cos sim = 0.86 with COSMIC Sig 5) and an additional signature (UNK) not matching any previously described signature. b Mutations and mutational signatures from post-only mutations. Here we consider only those post-treatment mutations not found in matched pre-treatment tumors. The top bar graph shows the number of mutations per trinucleotide sequence motif, and the bottom graphs show mutational signatures inferred in these mutations. Three signatures were inferred, two of which matched previously discovered signatures (AGING: cos sim = 0.86 with COSMIC Sig 1; APOBEC: cos sim = 0.90 with average of COSMIC Sig 2 and 13; UNK: an additional unmatched signature). c Inferred mutational signature activity in pre-treatment tumors and post-treatment tumors. The majority of mutations are inferred to be due to mutational signatures associated with APOBEC activity and nucleotide excision repair (NER) deficit, but 14% of mutations in the post-treatment tumors are associated with an unknown mutational signature
Fig. 3
Fig. 3
Evaluation of a potential cisplatin chemotherapy mutational signature. a Comparison of a chicken lymphoblast (DT40) cisplatin-induced mutational signature and the two unknown signatures found in the post-treatment and post-treatment-only mutational signatures. These are mutations induced in chicken lymphoblast (DT40) cells treated with cisplatin, adjusted for relative trinucleotide motif frequencies between the chicken and human genomes/exomes. The cos similarity of this signature with the candidate cisplatin signature is modest (0.58), but there are similar T > A motifs (cos sim = 0.87), and the two unknown signatures are similar to each other (cos sim = 0.90). b Correlation between DT40 cisplatin signature activity and the unknown signature activity in the same post-treatment tumors. We replaced the unknown signature with the DT40 cisplatin signature, and inferred its activity (Methods), yielding a Pearson correlation coefficient of 0.948 (p = 0.004 and p = 0.049 for a null distribution of correlations generated by replacing our candidate signature with permutations of the DT40 signature and combinations of COSMIC signatures, respectively (Methods)). cTranscriptional strand bias in the unknown signature. There was evidence of transcription strand bias in C > A (p = 5.8e-04), C > T (p = 0.003), T > A (p = 0.001), and T > C (p = 7.6e-04) (binomial test with null probability = 0.5). A bias against coding (+) strand mutations in C > X and T > X mutations is consistent with transcription coupled repair of platinum crosslinking in the non-coding strand at GpG and ApG motifs, which together represent 90% of crosslinking sites,. d Association of the unknown signature with subclonal mutations. We inferred relative proportions of clonal and subclonal mutations in post-treatment tumors attributed to each mutational signature in post-treatment tumors. The unknown signature has greater proportion of subclonal mutations (42%) compared to the overall average (22%) (chi-squared p = 6.2e-68 with DF = 3). N.S. = Not statistically significant; “*”Indicates p < 0.05; “**”Indicates p < 0.01
Fig. 4
Fig. 4
Intratumoral heterogeneity association with overall survival. a Overall survival of high and low pre-treatment intratumoral heterogeneity. We defined heterogeneity as the proportion of mutations per pre-treatment tumor that were inferred to be subclonal. In Cox proportional hazards analysis, pre-treatment heterogeneity was statistically significantly associated with overall survival (Cox PH: HRR 1.50 (95% CI 1.01–2.23), p = 0.046). Dividing the cohort above and below a cutoff of 20% of subclonal mutations (n = 16/14 low/high heterogeneity tumors, Supplementary Fig. 12a) resulted in a trend towards improved survival for pts with low pre-treatment heterogeneity (log-rank p = 0.088). b Overall survival of high and low post-treatment intratumoral heterogeneity. We defined heterogeneity as the proportion of mutations per post-treatment tumor that were inferred to be subclonal. In Cox proportional hazards analysis, post-treatment heterogeneity was negatively associated with overall survival (HRR 1.89 (95% CI 1.1–3.1), p = 0.013), and dividing the cohort above and below a cutoff of 20% of subclonal mutations (n = 16/14 low/high heterogeneity tumors, Supplementary Fig. 12b) resulted in improved survival for pts those with low post-treatment heterogeneity (log-rank p = 0.04). c Overall survival of high and low heterogeneity tumors. We defined heterogeneity as the number of inferred subclones (Methods), which includes shared subclones and subclones private to either the pre-treatment or post-treatment tumor. The number of subclones was negatively associated with overall survival (Cox PH: HRR 1.64 (95% CI 1.08–2.49), p = 0.02), and using a threshold of 6 clones (n = 15/15 with high/low heterogeneity as defined, Supplementary Fig. 12c) demonstrates improved survival for patients with low heterogeneity (log rank p = 0.004)
Fig. 5
Fig. 5
Pre and post-chemotherapy changes in individual cases. Patient 1—MSK-0745. a Clinical course of Patient 1 with no response to therapy, rapid recurrence and death. b Inferred phylogenetic tree showing acquired amplification of E2F3 and JUN in the post-treatment clones. c Graph of total genomic copy number showing focal copy number amplifications in segments containing JUN and E2F3 in the resistant tumor. Patient 2—DFCI-12. d Clinical course with no response to chemotherapy and recurrence and death at 605 and 646 days after initial biopsy, respectively. e Phylogenetic analysis demonstrating FBXW7 LOH in the pre-treatment tumor with subsequent additional FBXW7 E111* event detected in the post-treatment tumor. f Pre- and post- treatment cancer cell fractions (CCFs) of inferred tumor subclones. The subclone containing the FBXW7 E111* mutation had post-treatment CCF of 0.94 but was not detected in the pre-treatment tumor (CCF 0). The size of each subclone cloud represents the uncertainty in the inferred subclone’s pre- and post-treatment CCFs. Patient 3—FCCC-022. g Clinical course demonstrating poor response to neoadjuvant chemotherapy, recurrence at 258 days and death at 614 days. h Phylogenetic analysis demonstrating a gain in PD-L1/2 in the resistant sample, and that the resistant clone arose out of a pre-existing clone. i Pre- and post- treatment CCFs of inferred tumor subclones, with pre-treatment CCF on the x-axis and post-treatment CCF on the y-axis. A subclone with CCF 0.09 in the pre-treatment sample had CCF 1.0 in the post-treatment sample. The size of each subclone cloud represents the uncertainty in the inferred subclone’s pre- and post-treatment CCFs

Comment in

References

    1. Reed, E. in Cancer Chemotherapy and Biotherapy: Principles and Practice 5th edn (eds Chabner B. & Longo D.) (Wolters Kluwer, 2010).
    1. Emens LA, Middleton G. The interplay of immunotherapy and chemotherapy: harnessing potential synergies. Cancer Immunol. Res. 2015;3:436. doi: 10.1158/2326-6066.CIR-15-0064. - DOI - PMC - PubMed
    1. Freiha F, Reese J, Torti FM. A randomized trial of radical cystectomy versus radical cystectomy plus cisplatin, vinblastine and methotrexate chemotherapy for muscle invasive bladder cancer. J. Urol. 1996;155:495–499. doi: 10.1016/S0022-5347(01)66430-9. - DOI - PubMed
    1. Grossman HB, et al. Neoadjuvant chemotherapy plus cystectomy compared with cystectomy alone for locally advanced bladder cancer. N. Engl. J. Med. 2003;349:859–866. doi: 10.1056/NEJMoa022148. - DOI - PubMed
    1. von der Maase H, et al. Long-term survival results of a randomized trial comparing gemcitabine plus cisplatin, with methotrexate, vinblastine, doxorubicin, plus cisplatin in patients with bladder cancer. J. Clin. Oncol. 2005;23:4602–4608. doi: 10.1200/JCO.2005.07.757. - DOI - PubMed

Publication types

MeSH terms