Clinical Trial
. 2017 Dec 19;8(1):2185.
doi: 10.1038/s41467-017-02329-y.

The evolutionary landscape of chronic lymphocytic leukemia treated with ibrutinib targeted therapy

Affiliations
Clinical Trial

The evolutionary landscape of chronic lymphocytic leukemia treated with ibrutinib targeted therapy

Dan A Landau et al. Nat Commun. .

Abstract

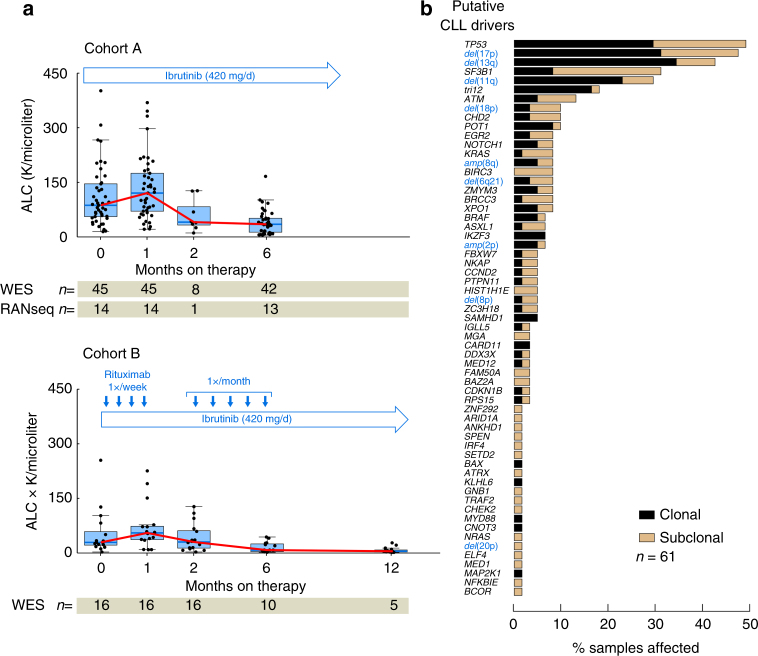
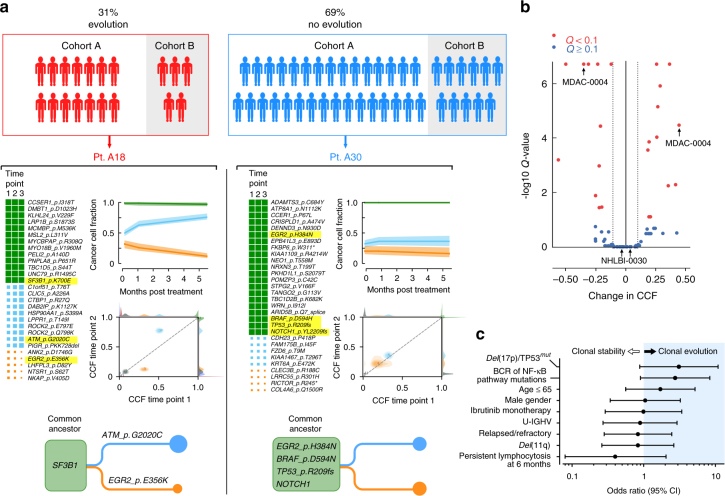
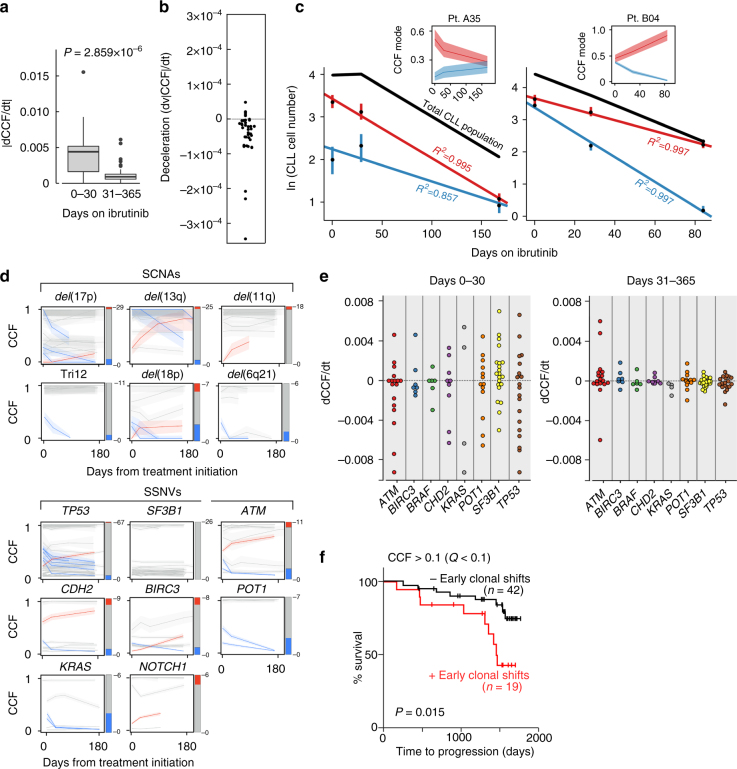
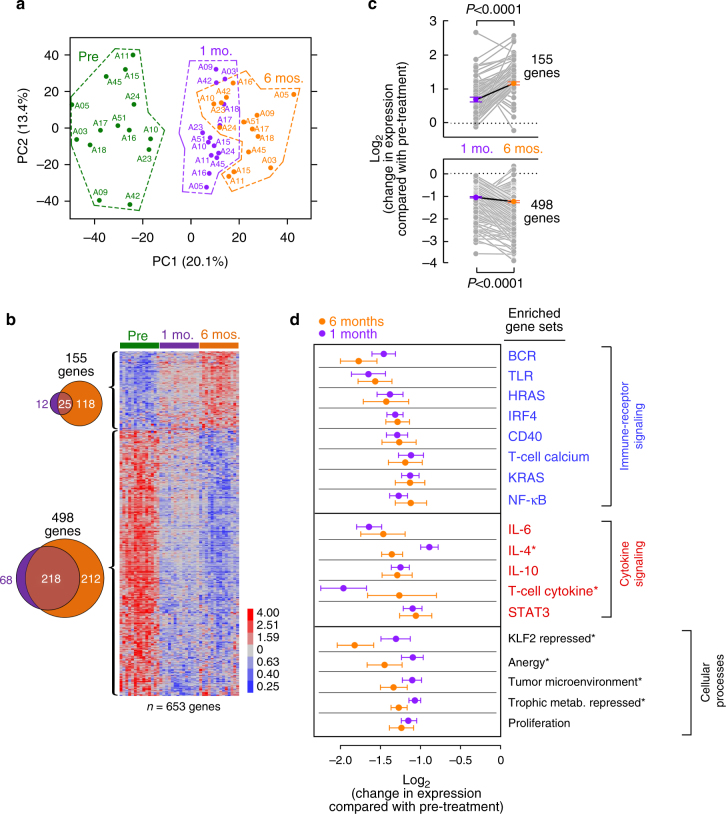
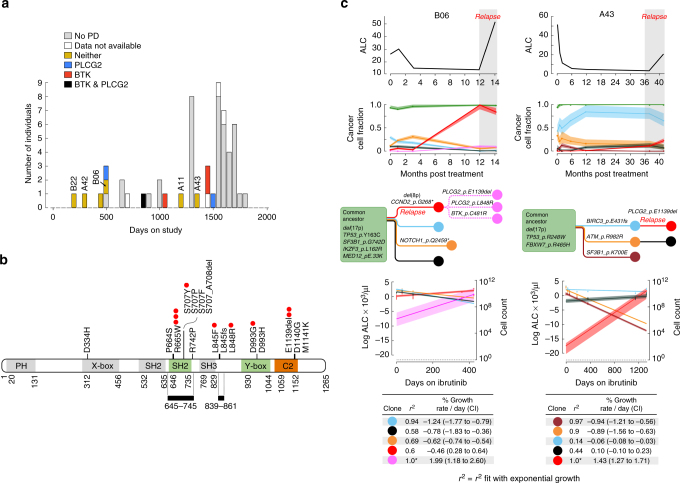
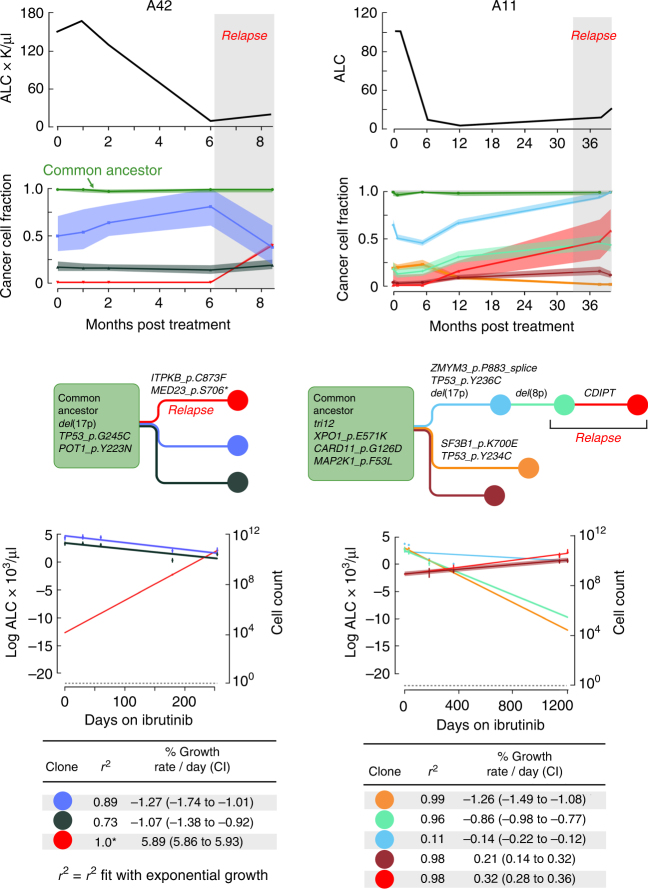
Treatment of chronic lymphocytic leukemia (CLL) has shifted from chemo-immunotherapy to targeted agents. To define the evolutionary dynamics induced by targeted therapy in CLL, we perform serial exome and transcriptome sequencing for 61 ibrutinib-treated CLLs. Here, we report clonal shifts (change >0.1 in clonal cancer cell fraction, Q < 0.1) in 31% of patients during the first year of therapy, associated with adverse outcome. We also observe transcriptional downregulation of pathways mediating energy metabolism, cell cycle, and B cell receptor signaling. Known and previously undescribed mutations in BTK and PLCG2, or uncommonly, other candidate alterations are present in seventeen subjects at the time of progression. Thus, the frequently observed clonal shifts during the early treatment period and its potential association with adverse outcome may reflect greater evolutionary capacity, heralding the emergence of drug-resistant clones.


Conflict of interest statement

C.J.W. is founder of Neon Therapeutics and a member of its scientific advisory board. A.W. and J.A.B. received research funding from Pharmacyclics, an Abbvie Company. J.A.B. received research funding from Gilead. A.W. received research funding from Acerta Pharma. The remaining authors declare no competing financial interests.

Figures

Fig. 1
Fig. 1
Putative driver gene mutations and copy number alterations at treatment initiation. a Treatment schema, absolute lymphocyte count (ALC) and number of samples per cohort that underwent whole-exome sequencing (WES) and RNA-sequencing at the indicated time points. Box plot shows the median, the interquartile range (IQR), and Tukey whiskers (±1.5 times IQR). b Distribution of clonal (black) and subclonal (tan) putative CLL driver mutations and copy number alterations (blue) across the 61 patients
Fig. 2
Fig. 2
Early clonal shifts during treatment with ibrutinib. a 31% of CLLs showed significant clonal shifts during the first year of therapy, excluding relapse timepoints to quantify early clonal shifts in the absence of disease progression. Examples show an evolved (left) and unevolved (right) CLL. For each of the two CLLs, n-dimensional clustering across multiple mutations and timepoints (left panel) allows the derivation of the clonal cancer cell fraction (CCF) for each subclone at each timepoint, integrating the CCF information of each of the mutations harbored by the subclone (top panel). Comparison of clonal CCF between pre-treatment and the latest pre-relapse samples enables to determine the presence of significant clonal shifts over time (middle panel) and phylogenetic tree inference (bottom). Candidate CLL driver mutations are highlighted in yellow. b The magnitude of change in CCF of the largest rising or falling clone within each patient over the duration studied is displayed as a function of the CCF change. Red data points indicate significant (q < 0.1, see Methods section for P value estimation) changes in subclone size and blue indicating non-significant changes. Median values of CCF change are shown as dotted lines. c Association between clinical characteristics and the risk of early clonal shifts (n = 61, except for U-IGHV (n = 57) and persistent lymphocytosis at 6 months (n = 60) due to data availability). FISH fluorescent in situ hybridization, U-IGHV unmutated IGHV gene, CI confidence interval
Fig. 3
Fig. 3
Genotype specific kinetics and disease progression on treatment. a Absolute CCF change per day (d|CCF|/dt) in the first period (first 30 days) and second period (beyond 30 days and up to 365 days) of significantly changing clones in patients with early clonal shifts. Box plot shows the median, the interquartile range (IQR), and Tukey whiskers (±1.5 times IQR, paired Welch’s t test). b The deceleration of change in CCF over the duration studied (dv|CCF|/dt) of these clones. c Measured circulating clonal sizes are shown for cases A35 and B04 (black dots represent the mode of CCF distribution multiplied by the number of circulating CLL cells, bars show 95% CI, CLL cell number is given in thousands of cells per microliter). The color curve represents fit with exponential growth with associated R 2 value. Total tumor burden is represented by the black line (ALC × sample purity) and insets show the corresponding changes in CCF for each CLL. d CCF change over time is shown for each putative CLL driver (somatic copy number alterations (SCNAs) and somatic single-nucleotide variations/indels (SSNVs)) represented by at least six instances across the patient cohorts. The bar on the right side of each plot reflects total number of clones harboring the indicated putative driver, with red, blue and gray representing the rate of significant CCF increase, decrease and no change, respectively. e The rate of change in CCF over time (dCCF/dt) does not demonstrate a clear trend by subclonal driver, as shown here in both the first time period (left) and second time period (right). f Kaplan–Meier plot of time-to-progression separated by the presence (red) or absence (black) of early clonal shifts (CCF change >0.1 with Q < 0.1)
Fig. 4
Fig. 4
Transcriptomic changes on treatment. a RNA-seq principal component analysis showing PC1 and PC2 across three time points. b Heat map of differentially expressed genes (fold change >2; FDR < 0.1; paired Student t test). 155 genes increased on drug; 498 genes deceased on drug. c Mean (±SEM) change in gene expression compared to pre-treatment across genes upregulated (top) and downregulated (bottom) on ibrutinib therapy. P values determined by a paired Student t test d Mean (±SEM) change in gene expression in experimentally derived gene sets that were enriched in genes downregulated on ibrutinib across patients. Asterisks represent significant difference in gene expression between 1 month and 6 months as determined by a paired Student t test. Genes sets in blue represent immune-receptor signaling, red represent cytokine signaling and brown represent general cellular responses. In all panels, green color is assigned to pre-treatment samples, purple to 1 month samples and orange 6 months samples in 14 patients totaling 42 samples
Fig. 5
Fig. 5
PLCG2 mutations in ibrutinib resistant CLL. a The relapse characteristics are provided for the entire cohort. Patients without progressive disease (PD), are shown in gray with the time from treatment initiation to the last follow-up. For patients with PD, in addition to the time-to-progression, we provide the resistant genotype information. b Map of the PLCG2 gene with mutations identified in cases of ibrutinib resistance,,,. Red circles denote the number of patients with indicated mutations identified in the current study. Gray bars denote the regions covered by targeted sequencing. Domains PH Pleckstrin homology, X-box phosphatidylinositol-specific phospholipase C X domain, SH2 1 C-terminal Src homology 2, SH2 2 N-terminal Src homology 2, SH3 Src homology 3, Y-box phosphatidylinositol-specific phospholipase C Y domain, C2 calcium-binding motif. c Detailed information is presented for the two cases in which WES revealed additional PLCG2 mutations. Top panel shows the absolute lymphocyte count (ALC) over the patient’s clinical course, as well as changes in CCF of subclones as depicted in the inferred phylogenetic tree. Bottom panel shows the inferred growth kinetics of the different subclones, including measurements with corresponding 95% CI, as well as the exponential growth curves with 95% CI as shaded area. The calculated growth or decline rates from the exponential growth curves as well as the corresponding R 2 fit with exponential growth dynamics is listed in the table in the bottom panel. *We note that clones with R 2 = 1.0 merely reflects that only two data points were available for fitting
Fig. 6
Fig. 6
Disease progression without BTK or PLCG2 mutations. As in Fig. 5, detailed information is presented for two cases in which WES revealed no PLCG2 or BTK mutations. Top panel shows the absolute lymphocyte count (ALC) over the patient’s clinical course, as well as changes in CCF of subclones as depicted in the inferred phylogenetic tree. Bottom panel shows the inferred growth kinetics of the different subclones, including measurements with corresponding CI, as well as the exponential growth curves with CI as shaded area. The calculated growth or decline rates from the exponential growth curves as well as the corresponding R 2 fit with exponential growth dynamics is listed in the table in the bottom panel. *We note that R 2 = 1.0 merely reflects that only two data points were available for fitting

References

    1. Schuh A, et al. Monitoring chronic lymphocytic leukemia progression by whole genome sequencing reveals heterogeneous clonal evolution patterns. Blood. 2012;120:4191–4196. doi: 10.1182/blood-2012-05-433540. - DOI - PubMed
    1. Fabbri G, et al. Genetic lesions associated with chronic lymphocytic leukemia transformation to Richter syndrome. J. Exp. Med. 2013;210:2273–2288. doi: 10.1084/jem.20131448. - DOI - PMC - PubMed
    1. Landau DA, Carter SL, Getz G, Wu CJ. Clonal evolution in hematological malignancies and therapeutic implications. Leukemia. 2014;28:34–43. doi: 10.1038/leu.2013.248. - DOI - PMC - PubMed
    1. Landau DA, Wu CJ. Chronic lymphocytic leukemia: molecular heterogeneity revealed by high-throughput genomics. Genome Med. 2013;5:47. doi: 10.1186/gm451. - DOI - PMC - PubMed
    1. Landau DA, et al. Evolution and impact of subclonal mutations in chronic lymphocytic leukemia. Cell. 2013;152:714–726. doi: 10.1016/j.cell.2013.01.019. - DOI - PMC - PubMed

Publication types

MeSH terms