. 2017 Dec 19;7(1):17825.
doi: 10.1038/s41598-017-17664-9.

No Evidence that Knops Blood Group Polymorphisms Affect Complement Receptor 1 Clustering on Erythrocytes

Affiliations

No Evidence that Knops Blood Group Polymorphisms Affect Complement Receptor 1 Clustering on Erythrocytes

O V Swann et al. Sci Rep. .

Abstract

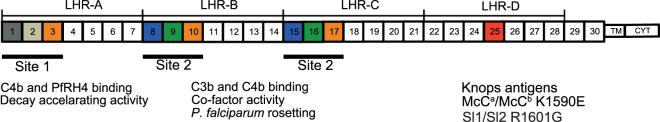
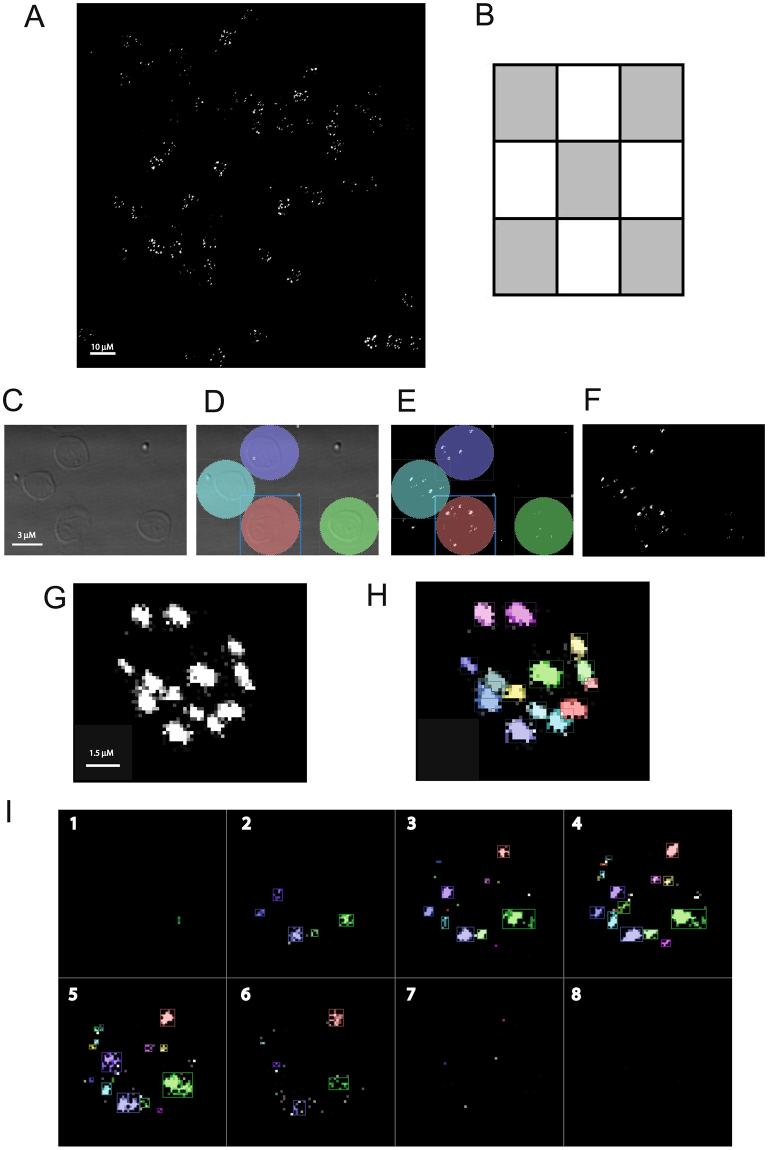
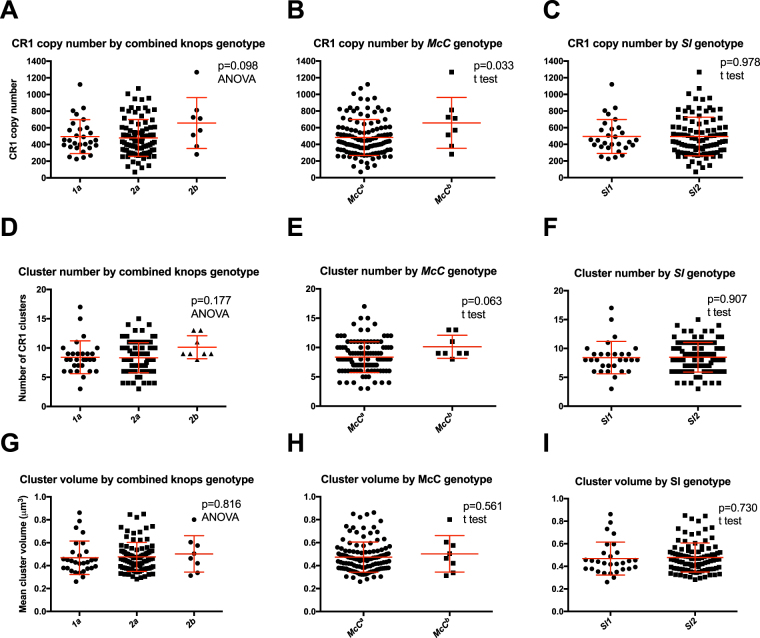
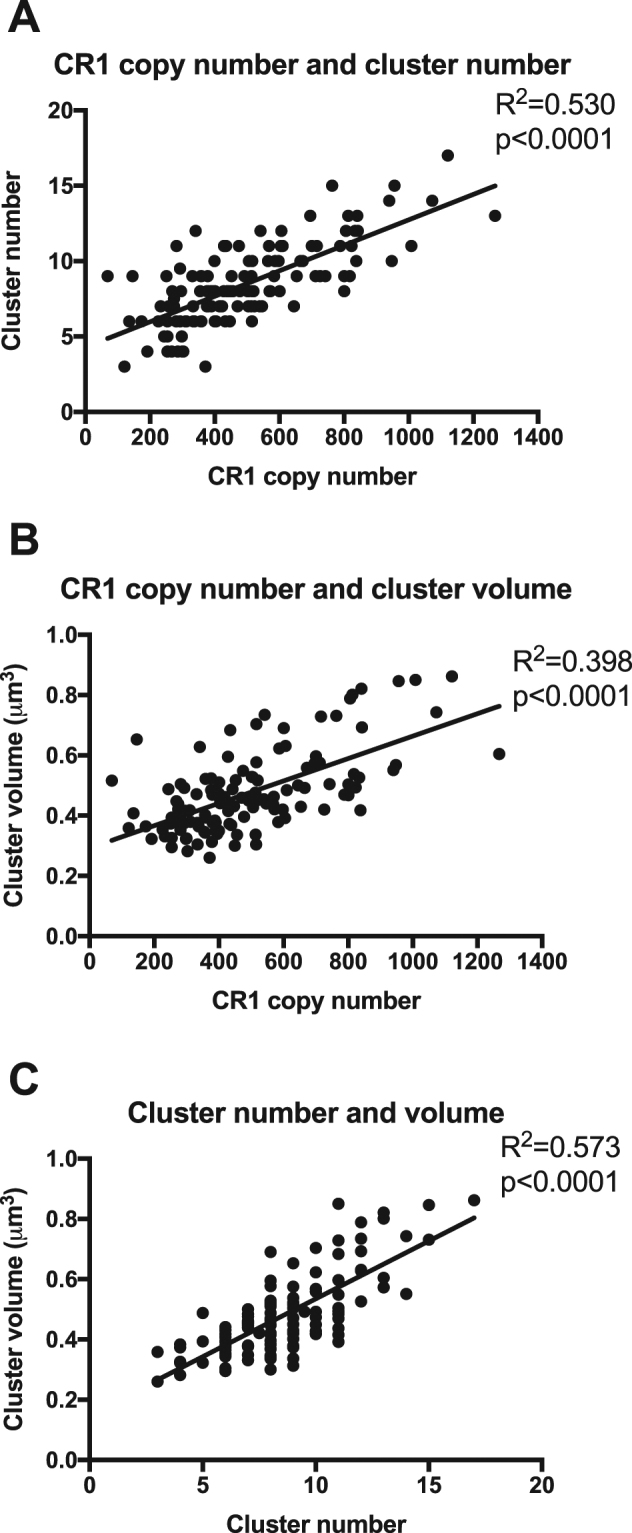
Clustering of Complement Receptor 1 (CR1) in the erythrocyte membrane is important for immune-complex transfer and clearance. CR1 contains the Knops blood group antigens, including the antithetical pairs Swain-Langley 1 and 2 (Sl1 and Sl2) and McCoy a and b (McCa and McCb), whose functional effects are unknown. We tested the hypothesis that the Sl and McC polymorphisms might influence CR1 clustering on erythrocyte membranes. Blood samples from 125 healthy Kenyan children were analysed by immunofluorescence and confocal microscopy to determine CR1 cluster number and volume. In agreement with previous reports, CR1 cluster number and volume were positively associated with CR1 copy number (mean number of CR1 molecules per erythrocyte). Individuals with the McC b /McC b genotype had more clusters per cell than McC a /McC a individuals. However, this association was lost when the strong effect of CR1 copy number was included in the model. No association was observed between Sl genotype, sickle cell genotype, α+thalassaemia genotype, gender or age and CR1 cluster number or volume. Therefore, after correction for CR1 copy number, the Sl and McCoy polymorphisms did not influence erythrocyte CR1 clustering, and the effects of the Knops polymorphisms on CR1 function remains unknown.


Conflict of interest statement

The authors declare that they have no competing interests.

Figures

Figure 1
Figure 1
Diagram of the most common CR1 size variant (CR1*1). Adapted from Schmidt et al.. The extracellular domain of CR1 is composed of 30 Complement Control Protein (CCP) domains organized into four “Long Homologous Repeats” (LHR). Two major functional sites are found within the CR1 molecule. Site 1 is located in LHR-A (CCP 1–3) and is the binding site for C4b and the Plasmodium falciparum invasion ligand PfRh4, and has decay accelerating activity. Site 2 is located in LHR-B (CCP 8–10) and LHR-C (CCP 15–17), and binds C3b and C4b, and interacts with P. falciparum infected erythrocytes to form rosettes. In addition, site 2 has Factor I-cofactor activity. SNPs determining the Sl and McC polymorphisms are localized in LHR-D (CCP 25, shown in red). CCP regions within Sites 1 and 2 that share high sequence identity (between 1 to 3 amino acid changes) are represented with identical shading. TM, transmembrane region; CYT, cytoplasmic tail.
Figure 2
Figure 2
Immunofluorescent staining of erythrocyte CR1 clusters and image analysis. (A) Erythrocyte CR1 clusters were visualised by staining with 5 μg/ml of CR1 monoclonal antibody J3D3, followed by 4 μg/ml of Alexa Fluor 488 goat anti-mouse IgG. See methods for full details. (B) For each donor, five confocal microscopy images were taken from the central area of the microscope slide as indicated by the grey shaded areas. Each image was a Z-stack comprising 8–10 steps. (C–F) To illustrate the image analysis process, a section containing 4 erythrocytes from one of the 5 images from a single donor is shown. Overall, at least 200 erythrocytes were examined per donor. (C) For each image, the bright-field view was used to identify the positions of erythrocytes. (D) Non-touching cells were then stamped. (E) The stamped region was then applied to the fluorescent image. (F) Cluster numbers and volumes within the stamped regions were assessed by an automated protocol using Volocity software as described in the methods. (G) An example of the clusters identified in a single erythrocyte. (H) The same erythrocyte as shown in G, with distinct clusters being shown in different colours. (I) A different erythrocyte with each of the 8 steps that comprise the Z-stack shown separately (1 to 8). These images can also be viewed as a video (Supplementary Videos 1 and 2).
Figure 3
Figure 3
The McC b genotype is associated with increased CR1 copy number and cluster number. Preliminary exploration of the association of Swain Langley (Sl) and McCoy (McC) genotypes with CR1 copy number (mean number of CR1 molecules per erythrocyte), median CR1 cluster number per cell and mean cluster volume. Panels (A–C) Relationship between CR1 copy number and (A) combined Sl and McC genotype (1a = Sl1/Sl1 McC a /McC a, 2a = Sl2/Sl2 McC a /McC a and 2b = Sl2/Sl2 McC b /McC b), (B) McC genotype and (C) Sl genotype. Panels (D–F) Relationship between median number of CR1 clusters per cell and (D) combined Sl and McC genotype, (E) McC genoype and (F) Sl genotype. Panels (G–I) Relationship between mean CR1 cluster volume per cell and (G) combined Sl and McC genotype, (H) McC genoype and (I) Sl genotype. Red bars indicate mean and standard deviation, with statistical testing by t test or ANOVA as indicated. Individuals with the McC b genotype had significantly higher CR1 copy numbers than McC a individuals, and showed a trend towards higher CR1 cluster numbers, although this was not statistically significant.
Figure 4
Figure 4
Positive correlation between CR1 copy number, cluster number and cluster volume. (A) Scatter plot of median CR1 cluster number per cell by CR1 copy number (mean number of CR1 molecules per cell) with linear regression. Each dot represents an individual donor. (B) Scatter plot of mean CR1 cluster volume by CR1 copy number with linear regression. Each dot represents an individual donor. (C) Scatter plot of mean CR1 cluster volume by median CR1 cluster number with linear regression. Each dot represents an individual donor. There were significant positive correlations between all three variables studied.

References

    1. Fearon DT. Human Complement Receptors for C3b (CR1) and C3d (CR2) J. Invest. Dermatol. 1985;85:53s–57s. doi: 10.1111/1523-1747.ep12275473. - DOI - PubMed
    1. Vik DP, Wong WW. Structure of the gene for the F allele of complement receptor type 1 and sequence of the coding region unique to the S allele. J. Immunol. 1993;151:6214–6224. - PubMed
    1. Dykman TR, Hatch JA, Aqua MS, Atkinson JP. Polymorphism of the C3b/C4b receptor (CR1): characterization of a fourth allele. J. Immunol. 1985;134:1787–1789. - PubMed
    1. Wong WW. Structural and Functional Correlation of the Human Complement Receptor Type 1. J. Invest. Dermatol. 1990;94:64s–67s. doi: 10.1111/1523-1747.ep12875150. - DOI - PubMed
    1. Moulds JM, Moulds JJ, Brown M, Atkinson JP. Antiglobulin testing for CR1-related (Knops/McCoy/Swain-Langley/York) blood group antigens: negative and weak reactions are caused by variable expression of CR1. Vox Sang. 1992;62:230–235. - PubMed

Publication types