. 2017 Dec 19;7(1):17816.
doi: 10.1038/s41598-017-17876-z.

Leveraging uncertainty information from deep neural networks for disease detection

Affiliations

Leveraging uncertainty information from deep neural networks for disease detection

Christian Leibig et al. Sci Rep. .

Abstract

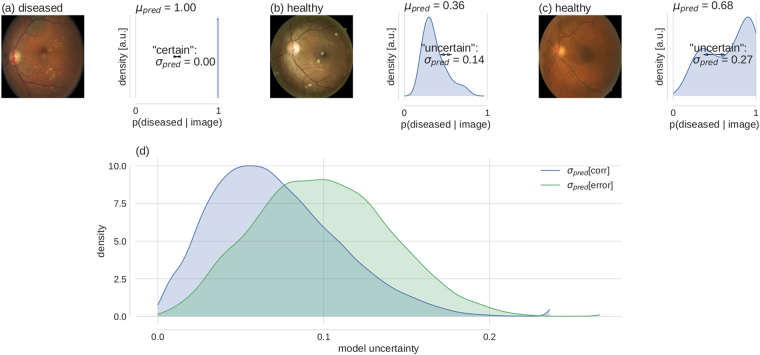
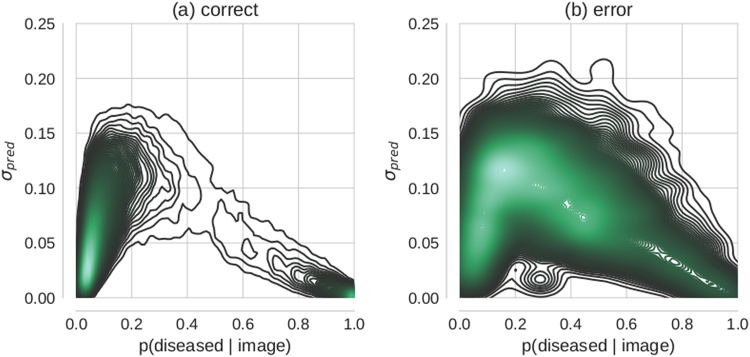
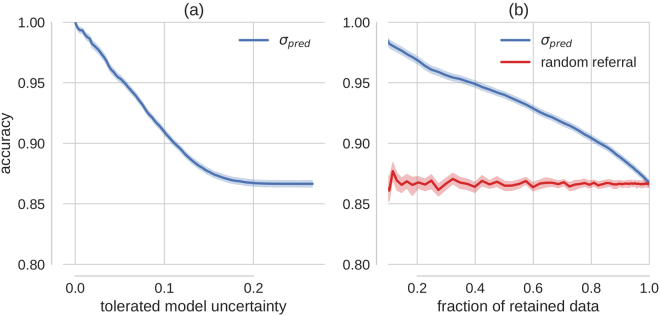
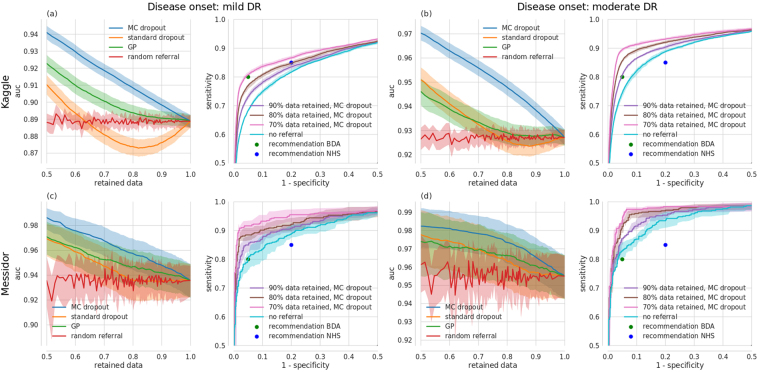
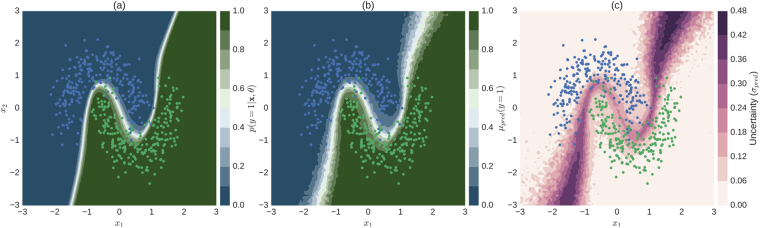
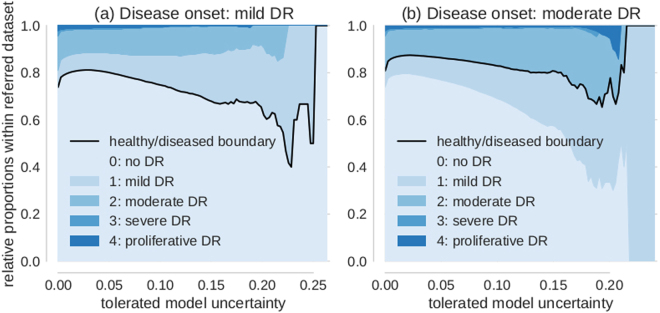
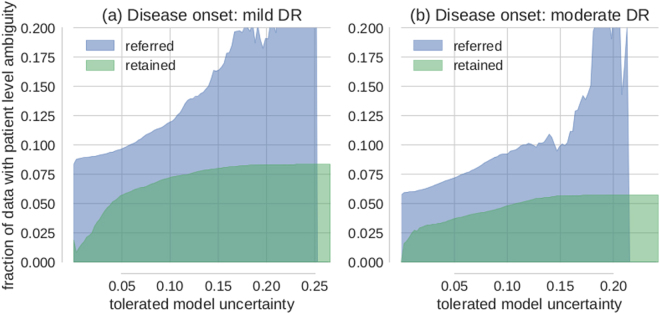
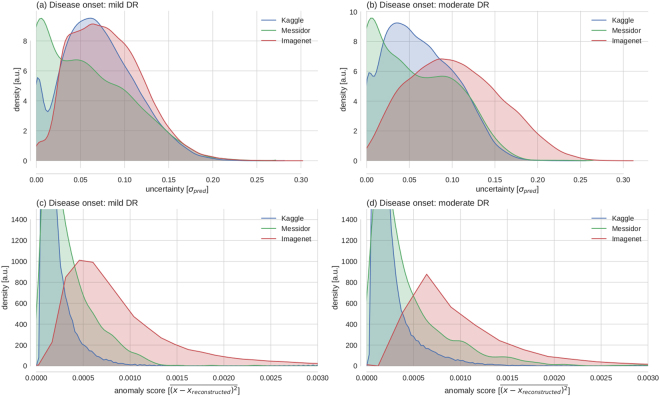
Deep learning (DL) has revolutionized the field of computer vision and image processing. In medical imaging, algorithmic solutions based on DL have been shown to achieve high performance on tasks that previously required medical experts. However, DL-based solutions for disease detection have been proposed without methods to quantify and control their uncertainty in a decision. In contrast, a physician knows whether she is uncertain about a case and will consult more experienced colleagues if needed. Here we evaluate drop-out based Bayesian uncertainty measures for DL in diagnosing diabetic retinopathy (DR) from fundus images and show that it captures uncertainty better than straightforward alternatives. Furthermore, we show that uncertainty informed decision referral can improve diagnostic performance. Experiments across different networks, tasks and datasets show robust generalization. Depending on network capacity and task/dataset difficulty, we surpass 85% sensitivity and 80% specificity as recommended by the NHS when referring 0-20% of the most uncertain decisions for further inspection. We analyse causes of uncertainty by relating intuitions from 2D visualizations to the high-dimensional image space. While uncertainty is sensitive to clinically relevant cases, sensitivity to unfamiliar data samples is task dependent, but can be rendered more robust.


Conflict of interest statement

The authors declare that they have no competing interests.

Figures

Figure 1
Figure 1
Bayesian model uncertainty for diabetic retinopathy detection. (ac) left: Exemplary fundus images with human label assignments in the titles. (ac) right: Corresponding approximate predictive posteriors (Eq. 6) over the softmax output values p(diseased | image) (Eq. 1). Predictions are based on μ pred (Eq. 7) and uncertainty is quantified by σ pred (Eq. 8). Examples are ordered by increasing uncertainty from left to right. (d) Distribution of uncertainty values for all Kaggle DR test images, grouped by correct and erroneous predictions. Label assignment for “diseased” was based on thresholding μ pred at 0.5. Given a prediction is incorrect, there is a strong likelihood that the prediction uncertainty is also high.
Figure 2
Figure 2
Relation between Bayesian model uncertainty σ pred and maximum-likelihood, i.e. conventional softmax probabilities p(diseased/image). Each subplot shows the 2-dimensional density over Kaggle DR test set predictions conditioned on: correctly (a) vs. erroneously (b) classified images respectively.
Figure 3
Figure 3
Improvement in accuracy via uncertainty-informed decision referral. (a) The prediction accuracy as a function of the tolerated amount of model uncertainty. (b) Accuracy is plotted over the retained data set size (test data set size - referral data set size). The red curve shows the effect of rejecting the same number of samples randomly, that is without taking into account information about uncertainty. Exemplarily, if 20% of the data would be referred for further inspection, 80% of the data would be retained for automatic diagnostics. This results in a better test performance (accuracy ≥ 90%, point on blue curve) on the retained data than on 80% of the test data sampled uniformly (accuracy ≈ 87%, point on red curve). Uncertainty informed decision referral derived from the conventional softmax output cannot achieve consistent performance improvements (Fig. 4).
Figure 4
Figure 4
Improvement in receiver-operating-characteristics via uncertainty-informed decision referral for different networks/tasks (left vs. right double column), datasets (1st vs. 2nd row) and methods (1st and 3rd single column). (a), left) ROC AUC over the fraction of retained data under uncertainty informed (MC dropout: blue, Gaussian process: green, standard dropout: orange) and random (red) decision referral for a Bayesian CNN, trained for disease onset 1 and tested on Kaggle DR. (a, right) Exemplary ROC curves under decision referral using the best method from (a, left), that is MC dropout. ROC curves improve when increasing the number of referred samples (90/80/70% retained data: purple/brown/pink curves respectively) as compared to no referral (turquoise). Panels (b)–(d) have the same layout. National UK standards for the detection of sight-threatening diabetic retinopathy (in defined as moderate DR) from the BDA (80%/95% sensitivity/specificity, green dot) and the NHS (85%/80% sensitivity/specificity, blue dot) are given in all subpanels with ROC curves. (b) same as (a), but for disease onset 2. (c) Same network/task as in (a), but tested on Messidor. (d) Same network/task as in (b), but tested on Messidor.
Figure 5
Figure 5
Illustration of uncertainty for a 2D binary classification problem. (a) Conventional softmax output obtained by turning off dropout at test time (eq. 1). (b) Predictive mean of approximate predictive posterior (eq. 7). (c) Uncertainty, measured by predictive standard deviation of approximate predictive posterior (eq. 8). The softmax output (a) is overly confident (only a narrow region in input space assumes values other than 0 or 1) when compared to the Bayesian approach (b,c). Uncertainty (c) tends to be high for regions in input space through which alternative separating hyperplanes could pass. Colour-coded dots in all subplots correspond to test data the network has not seen during training.
Figure 6
Figure 6
Proportion of disease levels in referred datasets. The value on the x-axis indicates the uncertainty of a sample to be tolerated for automatic diagnosis. All samples in the referral dataset have thus uncertainties of at least the value on the x-axis. The relative proportion of disease levels for tolerated uncertainty = 0 corresponds to the prior. (a) Disease onset level is mild DR (1). Disease levels 0 and 1 neighbour the healthy/diseased boundary (black) and dominate the referral dataset for high but not intermediate uncertainty. (b) Disease onset level is moderate DR (2). In analogy to (a), disease levels 1 and 2 neighbour the healthy/diseased boundary (black) and dominate the decision referral populations with high in contrast to intermediate uncertainties.
Figure 7
Figure 7
Decision referral of images from ambiguous patients. (a) Disease onset is mild DR (1). (b) Disease onset is moderate DR (2). Both subplots show the relative proportion of images from ambiguous patients in the referred (blue) and retained (green) data buckets for various tolerated uncertainty values. Patient level ambiguity is defined by images whose contra-lateral eye (from the same patient) carries a different label. Note that the decision referral of images is based on the uncertainty from a single image. Ground truth labels and the contra-lateral eye information are only used as meta information for evaluation purposes. Especially in the high uncertainty regime, images from ambiguous patients are more likely to be referred for further inspection than accepted for automatic decision. This is in line with how a physician would decide because ambiguous patients have an undefined disease state and should be subject to further examination.
Figure 8
Figure 8
Uncertainty in face of (un)familiar data samples. (a) Empirical distributions of model uncertainty (σ pred) for familiar data with known semantic content (Kaggle) and unfamiliar data with known semantics (Messidor) vs. unknown semantics (Imagenet). (b) Same as in (a) but for the task of detecting moderate (2) instead of mild DR (1). (c,d) Reconstruction errors of a deep autoencoder trained on the penultimate layer features of the Kaggle training set. All distributions shown in a–d for Kaggle refer to the test set.

References

    1. Schmidhuber J. Deep Learning in Neural Networks: An Overview. Neural Networks. 2015;61:85–117. doi: 10.1016/j.neunet.2014.09.003. - DOI - PubMed
    1. Krizhevsky, A., Sutskever, I. & Hinton, G. E. ImageNet Classification with Deep Convolutional Neural Networks. Advances in Neural Information Processing Systems 1–9 (2012).
    1. Rusk N. Deep learning. Nature Methods. 2016;13:35–35. doi: 10.1038/nmeth.3707. - DOI
    1. LeCun Y, Bengio Y, Hinton G. Deep learning. Nature. 2015;521:436–444. doi: 10.1038/nature14539. - DOI - PubMed
    1. Ciresan DC, Giusti A, Gambardella LM, Schmidhuber J. Mitosis detection in breast cancer histology images with deep neural networks. Lecture Notes in Computer Science. 2013;8150:411–418. doi: 10.1007/978-3-642-40763-5_51. - DOI - PubMed

Publication types