. 2017 Dec 19;7(1):17812.
doi: 10.1038/s41598-017-18004-7.

A hippocampo-cerebellar centred network for the learning and execution of sequence-based navigation

Affiliations

A hippocampo-cerebellar centred network for the learning and execution of sequence-based navigation

Benedicte M Babayan et al. Sci Rep. .

Erratum in

Abstract

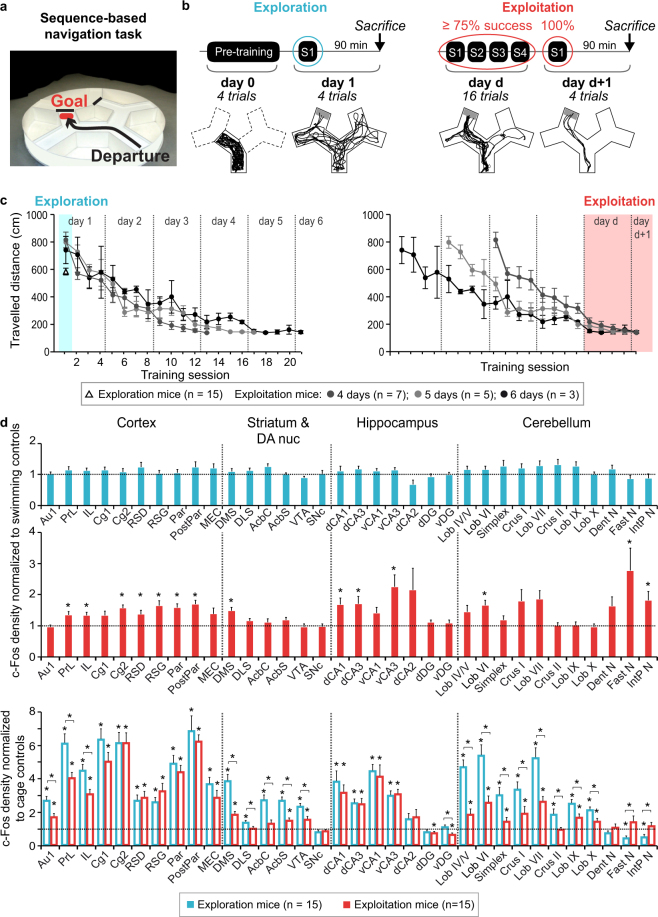
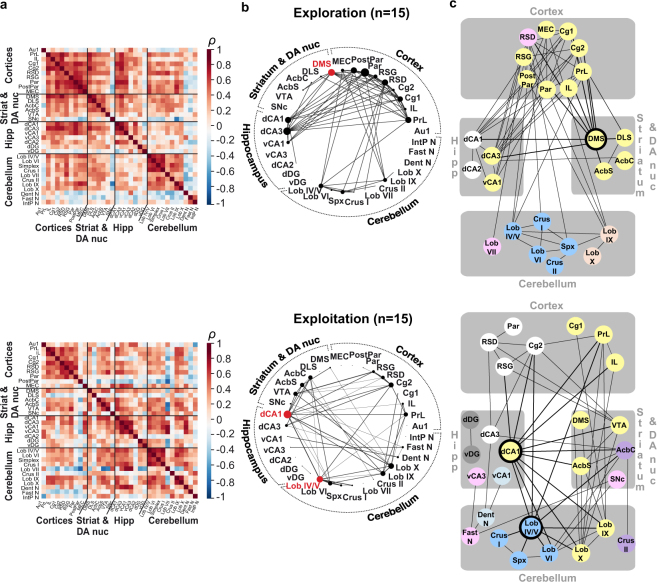
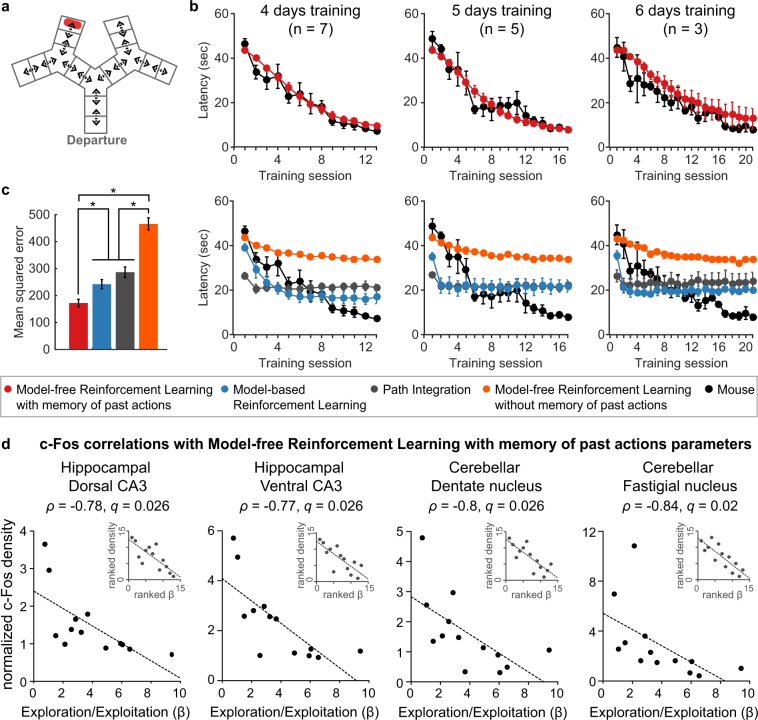
How do we translate self-motion into goal-directed actions? Here we investigate the cognitive architecture underlying self-motion processing during exploration and goal-directed behaviour. The task, performed in an environment with limited and ambiguous external landmarks, constrained mice to use self-motion based information for sequence-based navigation. The post-behavioural analysis combined brain network characterization based on c-Fos imaging and graph theory analysis as well as computational modelling of the learning process. The study revealed a widespread network centred around the cerebral cortex and basal ganglia during the exploration phase, while a network dominated by hippocampal and cerebellar activity appeared to sustain sequence-based navigation. The learning process could be modelled by an algorithm combining memory of past actions and model-free reinforcement learning, which parameters pointed toward a central role of hippocampal and cerebellar structures for learning to translate self-motion into a sequence of goal-directed actions.


Conflict of interest statement

The authors declare that they have no competing interests.

Figures

Figure 1
Figure 1
Behaviour and activation patterns across exploration and exploitation of sequence-based memory. (a) Mice learned a two-turn path in the sequence-based navigation task. (b) Left panel: Exploration mice did a pre-training session and the following day one training session during which they discovered the task. Below are shown the four trajectories of one exploration mouse for pre-training and session 1. Right panel: exploitation mice did 4 daily sessions until performing over 75% successful trials in one training day and 100% successful trials in one session the following day. Below are shown an exploitation mouse’s trajectories (13/16 correct trials, 4/4 correct trials the following day). (c) Exploration (Δ; left) and exploitation mice (●) travelled distance per session, aligned to the first session (left) or to the respective exploitation mice’s last session (right). Exploitation mice reached the exploitation criterion within 4, 5 or 6 training days and had comparable performances on their respective last two training days (right panel) (p > 0.2 for Kruskal-Wallis comparisons). Data represents mean ± s.e.m. (d) Top and middle: c-Fos positive cell densities for exploration and exploitation mice normalized to their respective swimming controls. Bottom: To compare c-Fos positive cell densities for exploration and exploitation mice, they are normalized to cage controls. Swimming and cage controls averages are indicated by the dotted horizontal lines. Exploration mice did not show any difference with their swimming controls, yet most structures had increased c-Fos positive cell densities compared to cage control mice. Exploitation mice showed increased activity in several areas, mostly cortical and hippocampal. The deep cerebellar fastigial and interpositus nuclei had a unique pattern of decreased activity in exploration mice compared to cage controls and increased c-Fos positive cell density in exploitation mice. *indicate significant differences (q < 0.05, FDR corrected, Mann Whitney comparisons). Data represents mean ± s.e.m. Abbreviations: cortex: primary auditory (Au1), prelimbic (PrL), infralimbic (IL), cingulate 1 and 2 (Cg1, Cg2), dysgranular and granular retrosplenial (RSD, RSG), parietal and posterior parietal (Par, PostPar), medial entorhinal (MEC); striatum and dopaminergic nuclei (DA nuc): dorsomedial striatum (DMS), dorsolateral striatum (DLS), nucleus accumbens core (AcbC) and shell (AcbS), ventral tegmental area (VTA), substantia nigra pars compacta (SNc); hippocampus: dorsal CA1 (dCA1), dorsal CA3 (dCA3), ventral CA1 (vCA1), ventral CA3 (vCA3), dorsal CA2 (dCA2), dorsal and ventral dentate gyrus (dDG, vDG); cerebellum: lobules IV/V (Lob IV/V), VI (Lob VI), VII (Lob VII), IX (Lob IX), X (Lob X), Simplex (Spx), dentate (Dent N), fastigial (Fast N) and interpositus nuclei (IntP N).
Figure 2
Figure 2
Functional network of the acquisition of a sequence-based memory. (a) Inter-regional correlation matrices for exploration (top) and exploitation (bottom) mice, each normalized to their respective controls. Axes correspond to brain structures. Colours reflect correlation strength (scale, right). (b) Network graphs generated by considering only the strongest correlations (Spearman’s ρ ≥ 0.64, p ≤ 0.01), with the thickness of the connections proportional to correlation strength and node size proportional to degree. Network hub structures are highlighted in red. The exploration mice’s network appears to be centred around cortical correlations with striatal, hippocampal and cerebellar structures, with the dorso-medial striatum as a network hub. The exploitation network is dominated by hippocampo-cerebellar correlations, with two network hubs, the hippocampal dorsal CA1 and cerebellar lobules IV/V. (c) Markov clustering algorithm was applied to organize brain structures into discrete color-coded modules based on their common inter-connections. Network hubs are highlighted in black. Consistent with the network graph analysis, the clustering in the exploration network revealed a major cortico-striatal cluster with the hub (in yellow), also containing hippocampal regions, and alongside three regionally confined clusters (a hippocampal cluster and two cerebellar clusters). In the exploitation network, the clustering revealed an interregional cluster with cortical, striatal, hippocampal and cerebellar structures (in yellow), alongside a cortico-hippocampal cluster (in white) and several other inter-regional clusters. The two exploitation network hubs (highlighted in black) belong to two different clusters and are at the interface of several other clusters, illustrating their central position in the network. Abbreviations: cortex: primary auditory (Au1), prelimbic (PrL), infralimbic (IL), cingulate 1 and 2 (Cg1, Cg2), dysgranular and granular retrosplenial (RSD, RSG), parietal and posterior parietal (Par, PostPar), medial entorhinal (MEC); striatum and dopaminergic nuclei (DA nuc): dorsomedial striatum (DMS), dorsolateral striatum (DLS), nucleus accumbens core (AcbC) and shell (AcbS), ventral tegmental area (VTA), substantia nigra pars compacta (SNc); hippocampus: dorsal CA1 (dCA1), dorsal CA3 (dCA3), ventral CA1 (vCA1), ventral CA3 (vCA3), dorsal CA2 (dCA2), dorsal and ventral dentate gyrus (dDG, vDG); cerebellum: lobules IV/V (Lob IV/V), VI (Lob VI), VII (Lob VII), IX (Lob IX), X (Lob X), Simplex (Spx), dentate (Dent N), fastigial (Fast N) and interpositus nuclei (IntP N).
Figure 3
Figure 3
Neural correlates of the exploration-exploitation balance of model-free reinforcement learning model with a memory of past actions. (a) Virtual maze used for the simulations. The maze was discretized in corridors, dead-ends and intersections. (b) Average curves of simulations for each mouse, which reached the exploitation criteria in 4 days (left), 5 days (centre) or 6 days (right). The simulations with 100 freely choosing agents per mouse tested the ability of each model to reproduce the behavioural data (black). The optimal parameters used for the simulations were identified by fitting each mouse’s actions on a trial-by-trial basis (Supplementary Table 5). Only the model-free reinforcement learning model with a memory of past actions successfully replicated mice behaviour (top), whereas other models were unable to reach the mice’s final performances (bottom). (c) Average mean-squared error between the simulations and the mice’s performances for each model tested, showing significantly lower mean-squared error with the model-free reinforcement learning model with a memory of past actions (*indicates q < 0.05, FDR corrected, Mann Whitney comparisons). (d) c-Fos correlations with model-free reinforcement learning with memory of past actions exploration/exploitation trade-off, for the 13 mice which showed a higher log-likelihood amongst the three models which can learn the sequence. Only hippocampal and cerebellar structures showed significant correlations (q < 0.05, FDR corrected, Spearman correlation). The main plot shows the correlation on the raw data and the inset in the top right hand side shows the same correlation on the ranked data, which is used to calculate Spearman’s correlation. Data represent mean ± s.e.m.

References

    1. Balleine BW, Dickinson A. Goal-directed instrumental action: Contingency and incentive learning and their cortical substrates. in. Neuropharmacology. 1998;37:407–419. - PubMed
    1. Yin HH, Knowlton BJ. The role of the basal ganglia in habit formation. Nat. Rev. Neurosci. 2006;7:464–76. - PubMed
    1. Dolan RJ, Dayan P. Goals and habits in the brain. Neuron. 2013;80:312–325. - PMC - PubMed
    1. Pezzulo G, van der Meer MAA, Lansink CS, Pennartz CMA. Internally generated sequences in learning and executing goal-directed behavior. Trends Cogn. Sci. 2014;18:647–657. - PubMed
    1. Diba K, Buzsáki G. Forward and reverse hippocampal place-cell sequences during ripples. Nat. Neurosci. 2007;10:1241–1242. - PMC - PubMed

Publication types

LinkOut - more resources