. 2017 Dec 19;7(1):17762.
doi: 10.1038/s41598-017-17999-3.

Comparative profiling of cortical gene expression in Alzheimer's disease patients and mouse models demonstrates a link between amyloidosis and neuroinflammation

Affiliations

Comparative profiling of cortical gene expression in Alzheimer's disease patients and mouse models demonstrates a link between amyloidosis and neuroinflammation

Erika Castillo et al. Sci Rep. .

Erratum in

Abstract

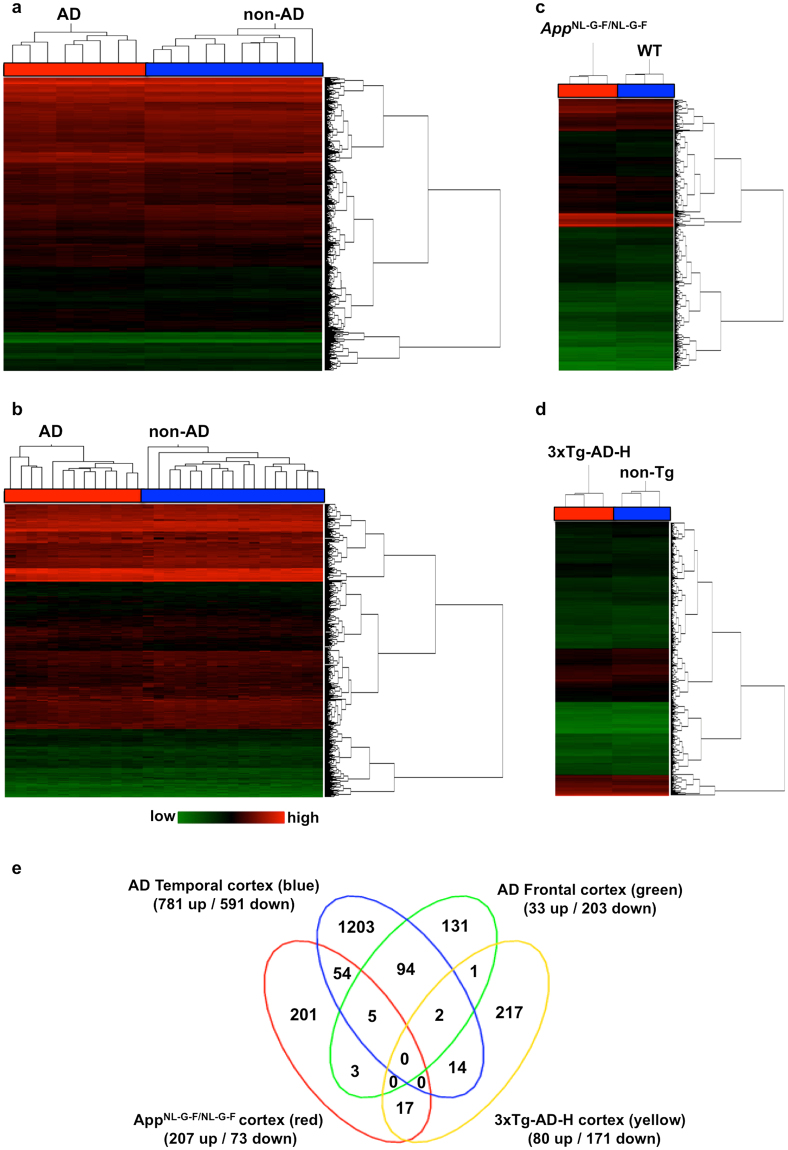
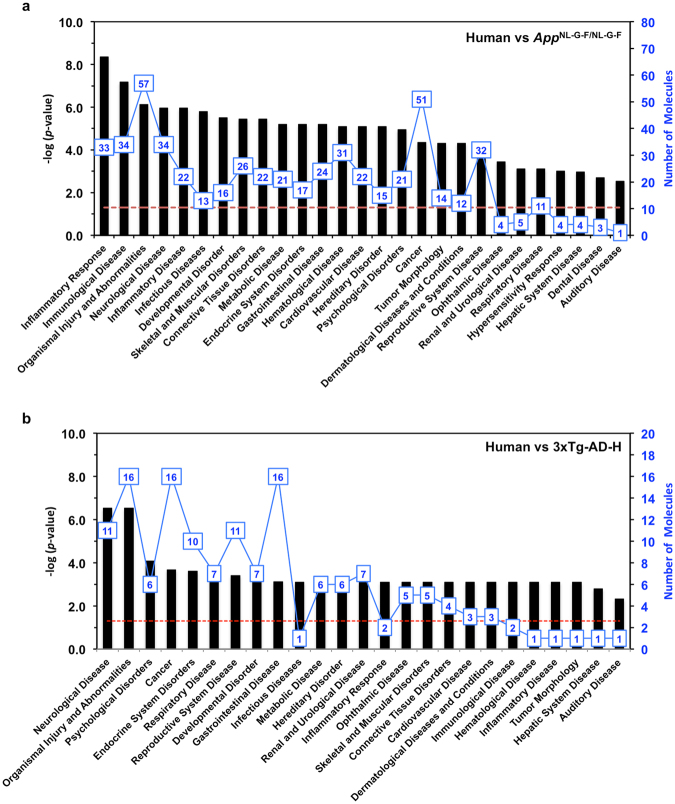
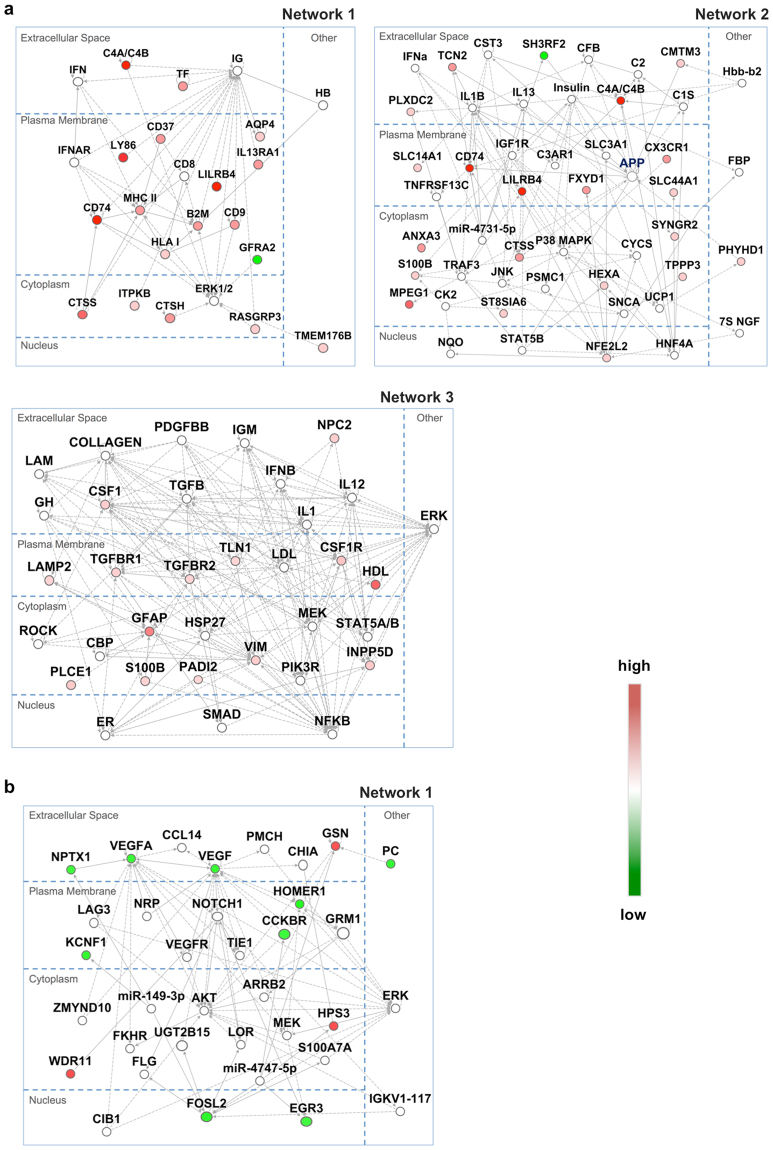
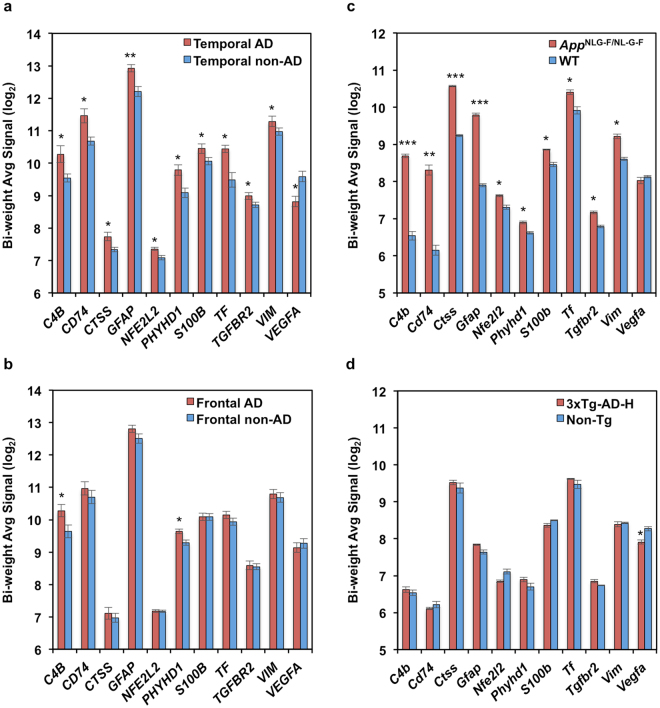
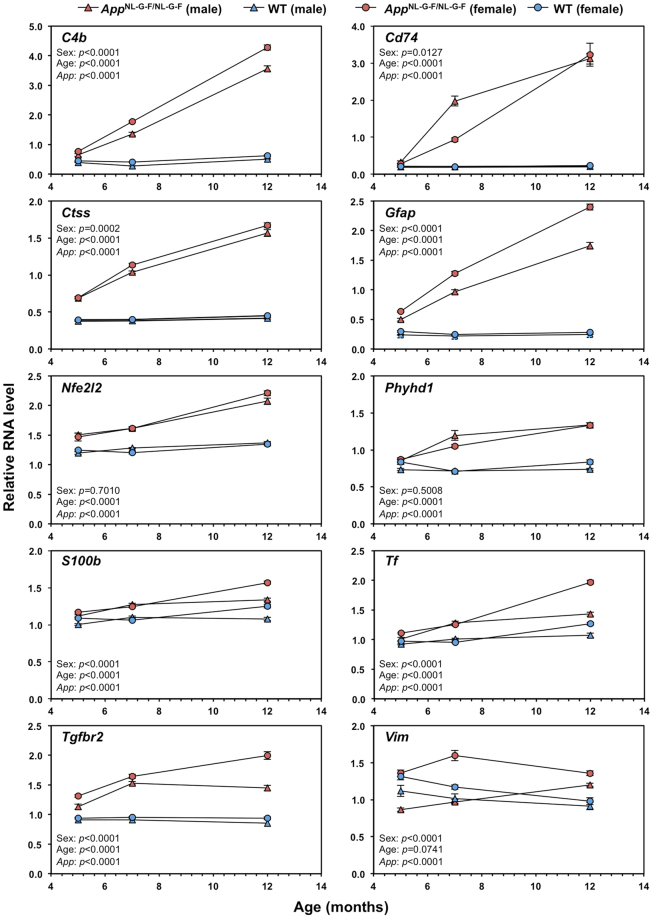
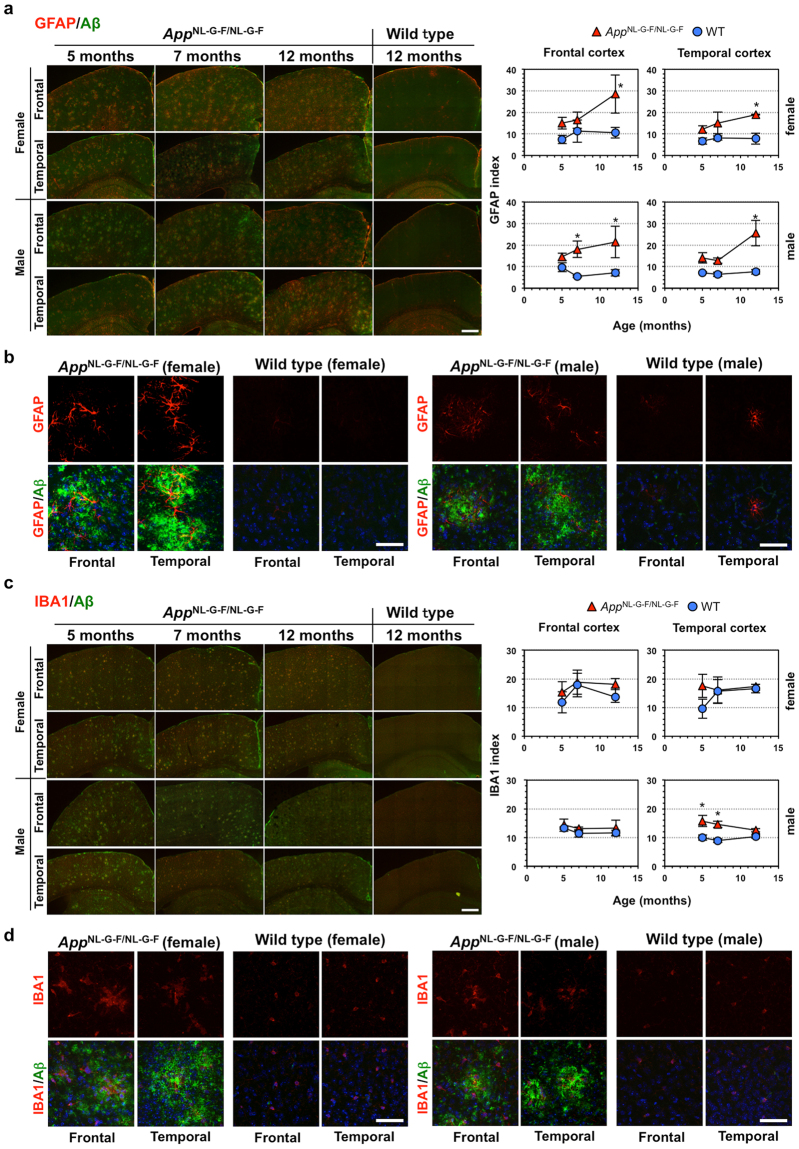
Alzheimer's disease (AD) is the most common form of dementia, characterized by accumulation of amyloid β (Aβ) and neurofibrillary tangles. Oxidative stress and inflammation are considered to play an important role in the development and progression of AD. However, the extent to which these events contribute to the Aβ pathologies remains unclear. We performed inter-species comparative gene expression profiling between AD patient brains and the App NL-G-F/NL-G-F and 3xTg-AD-H mouse models. Genes commonly altered in App NL-G-F/NL-G-F and human AD cortices correlated with the inflammatory response or immunological disease. Among them, expression of AD-related genes (C4a/C4b, Cd74, Ctss, Gfap, Nfe2l2, Phyhd1, S100b, Tf, Tgfbr2, and Vim) was increased in the App NL-G-F/NL-G-F cortex as Aβ amyloidosis progressed with exacerbated gliosis, while genes commonly altered in the 3xTg-AD-H and human AD cortices correlated with neurological disease. The App NL-G-F/NL-G-F cortex also had altered expression of genes (Abi3, Apoe, Bin2, Cd33, Ctsc, Dock2, Fcer1g, Frmd6, Hck, Inpp5D, Ly86, Plcg2, Trem2, Tyrobp) defined as risk factors for AD by genome-wide association study or identified as genetic nodes in late-onset AD. These results suggest a strong correlation between cortical Aβ amyloidosis and the neuroinflammatory response and provide a better understanding of the involvement of gender effects in the development of AD.


Conflict of interest statement

The authors declare that they have no competing interests.

Figures

Figure 1
Figure 1
Altered gene expression profiles in cortices of AD patients and AD mouse models. Lists of transcript clusters that exhibit significant alterations between AD patients and non-AD subjects or between AD mouse model and its control, obtained from microarray data (ANOVA: P < 0.05, fold change ≥ 1.2 or ≤−1.2), were subjected to hierarchical clustering analysis: (a) human AD temporal cortices, (b) human AD frontal cortices, (c) App NL-G-F/NL-G-F mouse cortices, (d) 3xTg-AD-H mouse cortices, compared with each control. Red columns indicate data from AD patients, App NL-G-F/NL-G-F and 3xTg-AD-H mice, blue columns represent data from each control. Levels of gene expression are shown in green (low) to red (high). (e) Venn diagram shows overlapping genes with significantly altered expression in each comparison (ANOVA: P < 0.05, log2 > 6.64, fold change ≥ 1.2 or ≤−1.2), between and among the four sets of comparisons. Total number of up- and downregulated genes in each group is shown in parentheses.
Figure 2
Figure 2
Biological functions of commonly altered genes in cortices of AD mouse models and AD patients. List of genes with commonly altered expression between the App NL-G-F/NL-G-F mouse and human AD cortices (frontal and temporal) shown in Supplementary Table S8 (a), and between the 3xTg-AD-H mouse and human AD cortices (frontal and temporal) shown in Supplementary Tables S9 (b), were subjected to IPA Core Analysis. In each graph, black bars indicate the P-value (−log [P-value]); blue lines indicate the number of molecules categorised in each biological function. The red dashed line indicates the threshold for P-value (−log [P-value] = 1.3).
Figure 3
Figure 3
Top networks of commonly altered genes in cortices of two AD mouse models and AD patients. (a) The top 3 networks of genes with commonly altered expression between the App NL-G-F/NL-G-F mouse and human AD cortices (frontal and temporal) shown in Supplementary Table S8. Network 1 includes 17 upregulated genes and 1 downregulated gene. Network 2 includes 20 upregulated genes and 1 downregulated gene. Network 3 includes 14 upregulated genes in AD cortices. We included a dashed line to connect Phyhd1 and App in Network 2, according to our results and a previous report. (b) The top network of genes with commonly altered expression between the 3xTg-AD-H mouse and human AD cortices (frontal and temporal) shown in Supplementary Table S9. Network 1 includes 3 upregulated and 9 downregulated genes in AD cortices. Encoded molecules were placed in an appropriate subcellular compartment based on IPA, and “other” denotes unspecific or unknown localization. Solid lines indicate direct interactions and dashed lines indicate indirect interactions. Fold change is denoted as a green-white-red colour gradient, from green (downregulated) to red (upregulated).
Figure 4
Figure 4
Comparison of expression levels of 11 common genes with functions related to Alzheimer’s disease. (a) Comparison between AD and non-AD temporal cortices. AD (n = 8), non-AD (n = 10). (b) Comparison between AD and non-AD frontal cortices. AD (n = 13), non-AD (n = 17). (c) Comparison between the App NL-G-F/NL-G-F and wild-type (WT) cortices (n = 3). (d) Comparison between the 3xTg-AD-H and non-Tg cortices (n = 3). Bi-weight average signal (log2) of the 11 AD-related genes obtained from microarray analysis are shown with SEM in bar graphs. Red bars, AD patients or AD mouse models; blue bars, non-AD or control mice. One-way between-subject ANOVA analysis was performed; *P < 0.05; **P < 0.001; ***P < 0.0001. Ten genes (C4A/C4B, CD74, CTSS, GFAP, NFE2L2, PHYHD1, S100B, TF, TGFBR2 and VIM) were commonly upregulated in both human AD temporal and App NL-G-F/NL-G-F cortices.
Figure 5
Figure 5
Effects of age and sex on expression levels of the 10 commonly upregulated genes related to Alzheimer’s disease in cortices of App NL-G-F/NL-G-F mice. Cortical RNA was isolated from male and female App NL-G-F/NL-G-F (red) and wild-type (WT, blue) mice (n = 3), at 5, 7 and 12 months of age, and subjected qRT-PCR. Expression levels, relative to Gapdh, of the 10 genes (C4b, Cd74, Ctss, Gfap, Nfe2l2, Phyhd1, S100b, Tf, Tgfbr2 and Vim) commonly upregulated in both App NL-G-F/NL-G-F mouse and human AD temporal cortices are shown. Data is expressed as mean value ± SEM of three independent mice performed in triplicate. Three-way ANOVA was performed and p-values for effects (sex, age and App genotype [App]) are shown. Detailed results of statistical analysis are shown in Supplementary Figs S6 and S7.
Figure 6
Figure 6
Effects of age and sex on amyloid β deposition and glial activation in cortices of App NL-G-F/NL-G-F mice. Double-immunofluorescence microscopy for Aβ and GFAP (a,b), and Aβ and IBA1 (c,d). Coronal sections containing frontal (Bregma: −1.255 to −1.455) and temporal (Bregma: +1.845 to +2.045) cortices prepared from 5-, 7- and 12-month-old, male and female App NL-G-F/NL-G-F and wild-type (WT) mice, were subjected to double-immunofluorescence microscopy using mouse anti-human Aβ (green) and either anti-GFAP or rabbit anti-IBA1 antibodies (red). (a,c) Multiple z-stack images of 15 fields were tiled and stacked together using ZEN imaging software. Each immunoreactivity was measured, and means with SEM (n = 3) of the GFAP (a) and IBA1 (c) index are shown in the graphs on the right. Scale bar = 500 μm. Student’s t-test was performed between the two mouse lines at the given ages; *P < 0.05. (b,d) Magnified images for 5-month-old samples are shown. Nuclei were stained with DAPI (blue) in double-immunofluorescence images. Scale bar = 50 µm.

References

    1. Prince, M., Comas-Herrera, A., Knapp, M., Guerchet, M. & Karagiannidou, M. World Alzheimer report 2016: improving healthcare for people living with dementia: coverage, quality and costs now and in the future. Alzheimer’s Disease International (ADI), London, UK (2016).
    1. Querfurth HW, LaFerla FM. Alzheimer’s Disease. N Engl J Med. 2010;362:329–344. doi: 10.1056/NEJMra0909142. - DOI - PubMed
    1. Abolhassani N, et al. Molecular pathophysiology of impaired glucose metabolism, mitochondrial dysfunction, and oxidative DNA damage in Alzheimer’s disease brain. Mech Ageing Dev. 2017;161:95–104. doi: 10.1016/j.mad.2016.05.005. - DOI - PubMed
    1. Calsolaro V, Edison P. Neuroinflammation in Alzheimer’s disease: Current evidence and future directions. Alzheimers Dement. 2016;12:719–732. doi: 10.1016/j.jalz.2016.02.010. - DOI - PubMed
    1. Heppner FL, Ransohoff RM, Becher B. Immune attack: the role of inflammation in Alzheimer disease. Nat Rev Neurosci. 2015;16:358–372. doi: 10.1038/nrn3880. - DOI - PubMed

Publication types

MeSH terms

Substances