. 2017 Dec 19;8(1):1966.
doi: 10.1038/s41467-017-01997-0.

Long-term carbon sink in Borneo's forests halted by drought and vulnerable to edge effects

Affiliations

Long-term carbon sink in Borneo's forests halted by drought and vulnerable to edge effects

Lan Qie et al. Nat Commun. .

Erratum in

  • Author Correction: Long-term carbon sink in Borneo's forests halted by drought and vulnerable to edges.
    Qie L, Lewis SL, Sullivan MJP, Lopez-Gonzalez G, Pickavance GC, Sunderland T, Ashton P, Hubau W, Abu Salim K, Aiba SI, Banin LF, Berry N, Brearley FQ, Burslem DFRP, Dančák M, Davies SJ, Fredriksson G, Hamer KC, Hédl R, Kho LK, Kitayama K, Krisnawati H, Lhota S, Malhi Y, Maycock C, Metali F, Mirmanto E, Nagy L, Nilus R, Ong R, Pendry CA, Poulsen AD, Primack RB, Rutishauser E, Samsoedin I, Saragih B, Sist P, Ferry Slik JW, Sukri RS, Svátek M, Tan S, Tjoa A, van Nieuwstadt M, Vernimmen RRE, Yassir I, Kidd PS, Fitriadi M, Ideris NKH, Serudin RM, Abdullah Lim LS, Saparudin MS, Phillips OL. Qie L, et al. Nat Commun. 2018 Jan 19;9(1):342. doi: 10.1038/s41467-018-02920-x. Nat Commun. 2018. PMID: 29352254 Free PMC article.

Abstract

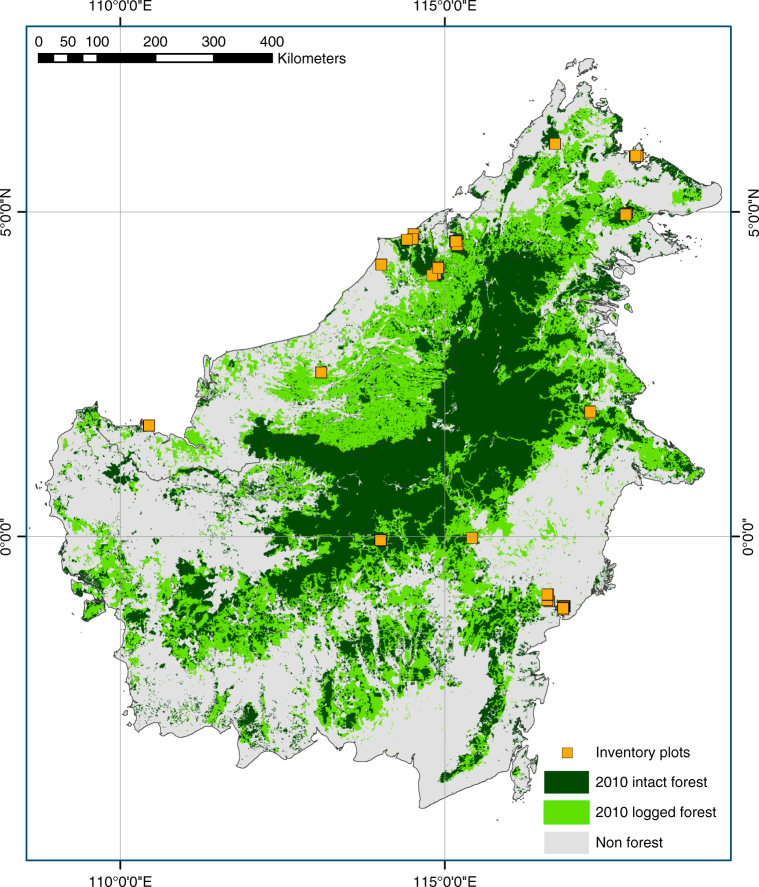
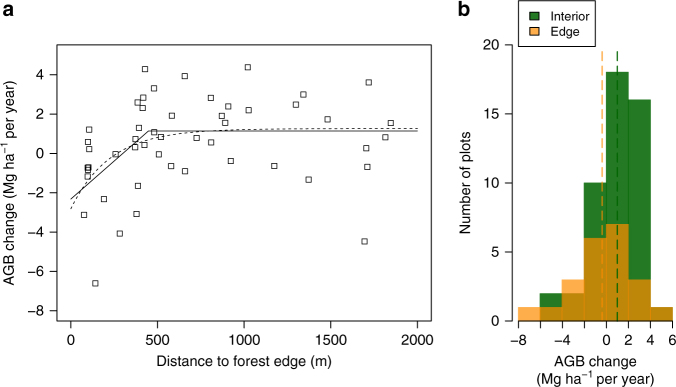
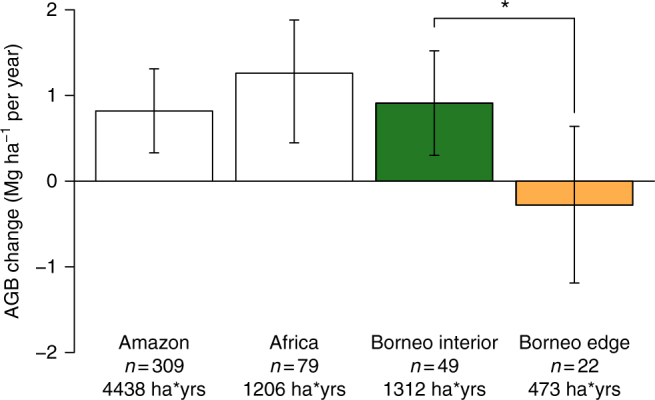
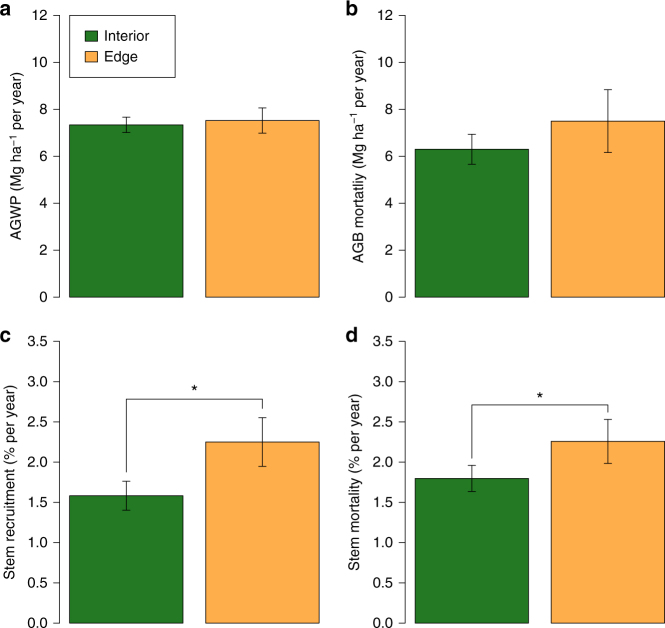
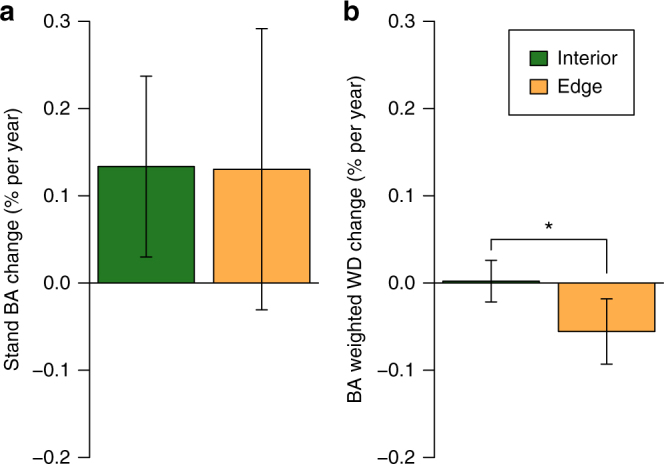
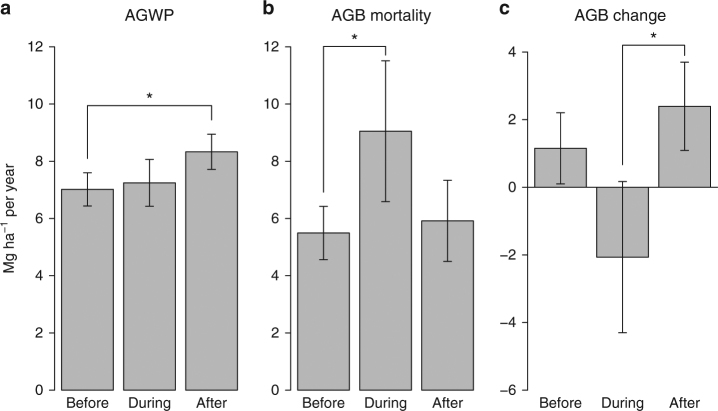
Less than half of anthropogenic carbon dioxide emissions remain in the atmosphere. While carbon balance models imply large carbon uptake in tropical forests, direct on-the-ground observations are still lacking in Southeast Asia. Here, using long-term plot monitoring records of up to half a century, we find that intact forests in Borneo gained 0.43 Mg C ha-1 per year (95% CI 0.14-0.72, mean period 1988-2010) above-ground live biomass. These results closely match those from African and Amazonian plot networks, suggesting that the world's remaining intact tropical forests are now en masse out-of-equilibrium. Although both pan-tropical and long-term, the sink in remaining intact forests appears vulnerable to climate and land use changes. Across Borneo the 1997-1998 El Niño drought temporarily halted the carbon sink by increasing tree mortality, while fragmentation persistently offset the sink and turned many edge-affected forests into a carbon source to the atmosphere.


Conflict of interest statement

The authors declare no competing financial interests.

Figures

Fig. 1
Fig. 1
Locations of 71 long-term forest monitoring plots shown on the 2010 Borneo forest cover map. Intact and logged forest cover are based on Gaveau et al. 2014, accessed at http://www.cgiar-csi.org/portfolio-items/forests-of-borneo. All plots were located in 2010 intact forest areas. Plot symbols overlap, with some obscuring the small forest fragments containing the plots
Fig. 2
Fig. 2
Anthropogenic edge impact on plot above-ground live biomass change in structurally intact forests of Borneo. a A hockey-stick model (solid line; break-point at 448 m, 1.14 Mg ha−1 per year) and asymptotic model (dashed line, asymptote 1.26 Mg ha−1 per year) showing saturating edge effect on AGB change. b Histograms of plot AGB change, weighted by the cube root of monitoring length, in forest interior (≥448 m, n = 49; mean 1.01 Mg ha−1 per year, green dashed line) and edge plots (<448 m, n = 22; mean −0.36 Mg ha−1 per year, orange dashed line)
Fig. 3
Fig. 3
Above-ground live biomass change rates in pan-tropical structurally intact forests. Results for Borneo (this study) were based on linear mixed effects (LME) model estimates for the mean period of 1988–2010 (spanning 1958–2015), showing contrast between forest interior plots and edge-affected plots. The most recent published estimates for similar periods for Amazon and tropical Africa are shown for comparison. All estimates are based on direct, ground measurements, with the number of long-term inventory plots and total monitoring effort (in ha years) indicated. Bars are 95% CIs. Only the difference between Borneo interior and edge plots was tested statistically where asterisk indicates significant difference (P = 0.034)
Fig. 4
Fig. 4
Contrasting forest dynamics observed in forest interior and close to anthropogenic edges in Borneo. Above-ground wood productivity (AGWP, a), Above-ground live biomass (AGB) mortality (b), stem recruitment (c) and mortality (d) rates are long-term means (mean monitoring period 1988–2010) estimated using linear mixed effects (LME) models. Bars are 95% CIs. Asterisks indicate significant difference (Stem mortality: P = 0.006; Stem recruitment: P < 0.001). Individual plot values for these variables are presented as histograms in Supplementary Fig. 5 showing variation in both interior and edge plots
Fig. 5
Fig. 5
Mean changes in stand basal area and basal area weighted mean wood density in forest interior and close to anthropogenic edges in Borneo.Stand basal area (BA, a) and BA weighted mean wood density (WD, b) were calculated on a proportional basis relative to values of the initial censuses of long-term plots in Borneo. Plots were classified as edge affected if within 448 m from anthropogenic edges. Values represent long-term trends (mean monitoring period 1988–2010) estimated using linear mixed effects (LME) models. Bars are 95% CIs. Asterisk indicates significant difference (P = 0.011). Individual plot values for these variables are presented as histograms in Supplementary Fig. 5 showing variation in both interior and edge plots
Fig. 6
Fig. 6
Biomass dynamics in 19 forest interior plots in Borneo that were monitored over the 1997–1998 El Niño. Above-ground wood productivity (AGWP, a), above-ground live biomass (AGB) mortality (b) and AGB change (c) were estimated for three mean time intervals: before drought 1978.6–1996.5, during drought 1996.5–2000.0 and after drought 2000.0–2011.1. Values shown are estimated from linear mixed effects (LME) models with 95% CIs (bars) for the 19 plots. Asterisks indicate significant difference based on non-overlapping CIs. Before–during–after trajectories for individual plots for each variable are presented in Supplementary Fig. 6

References

    1. Ciais, P. et al. in Climate Change 2013: The Physical Science Basis. Contribution of Working Group I to the Fifth Assessment Report of the Intergovernmental Panel on Climate Change (eds Thomas F. Stocker et al) 465–570 (Cambridge University Press, 2013).
    1. Zhu Z, et al. Greening of the Earth and its drivers. Nat. Clim. Change. 2016;6:791–795. doi: 10.1038/nclimate3004. - DOI
    1. Sitch S, et al. Recent trends and drivers of regional sources and sinks of carbon dioxide. Biogeosciences. 2015;12:653–679. doi: 10.5194/bg-12-653-2015. - DOI
    1. Gatti LV, et al. Drought sensitivity of Amazonian carbon balance revealed by atmospheric measurements. Nature. 2014;506:76–80. doi: 10.1038/nature12957. - DOI - PubMed
    1. Stephens BB, et al. Weak northern and strong tropical land carbon uptake from vertical profiles of atmospheric CO2. Science. 2007;316:1732–1735. doi: 10.1126/science.1137004. - DOI - PubMed

Publication types