. 2017 Dec 19;7(1):17796.
doi: 10.1038/s41598-017-18253-6.

Modelling neuroanatomical variation during childhood and adolescence with neighbourhood-preserving embedding

Affiliations

Modelling neuroanatomical variation during childhood and adolescence with neighbourhood-preserving embedding

Gareth Ball et al. Sci Rep. .

Abstract

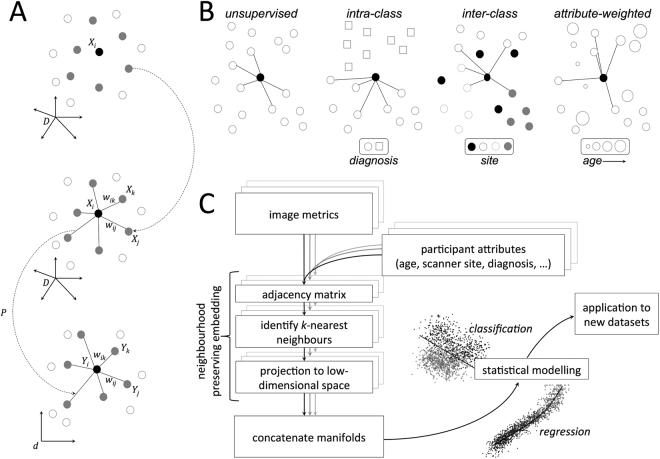
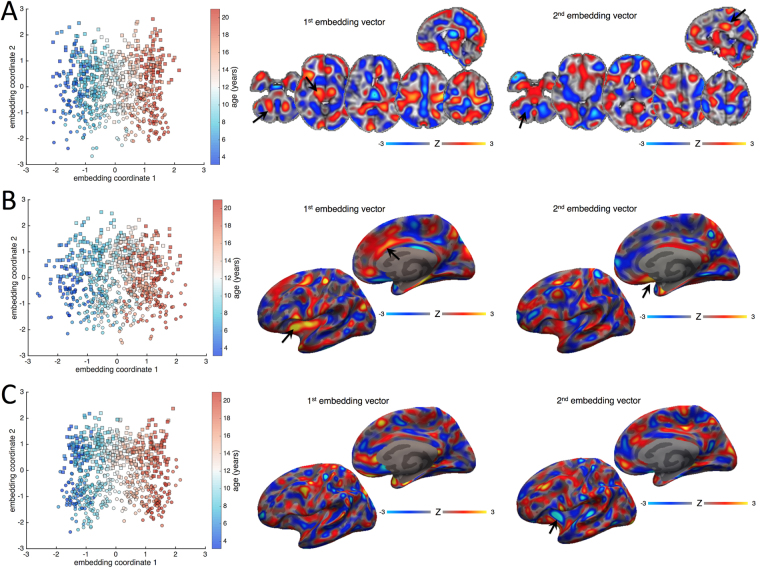
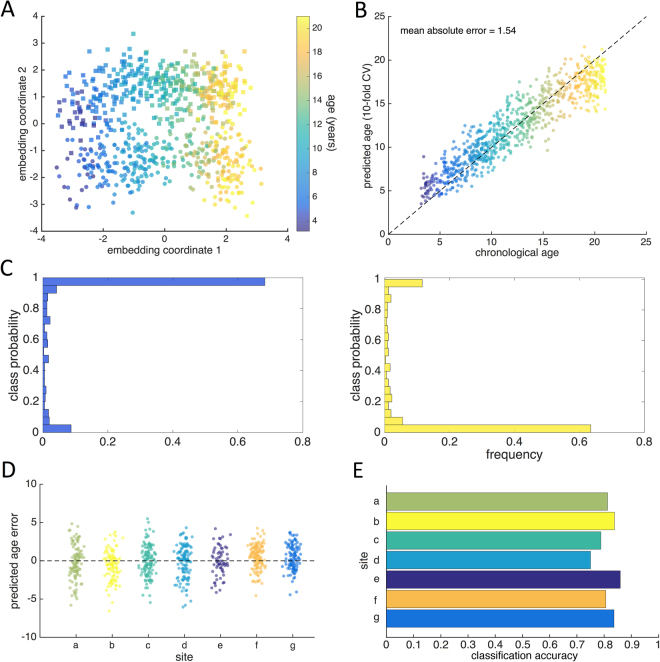
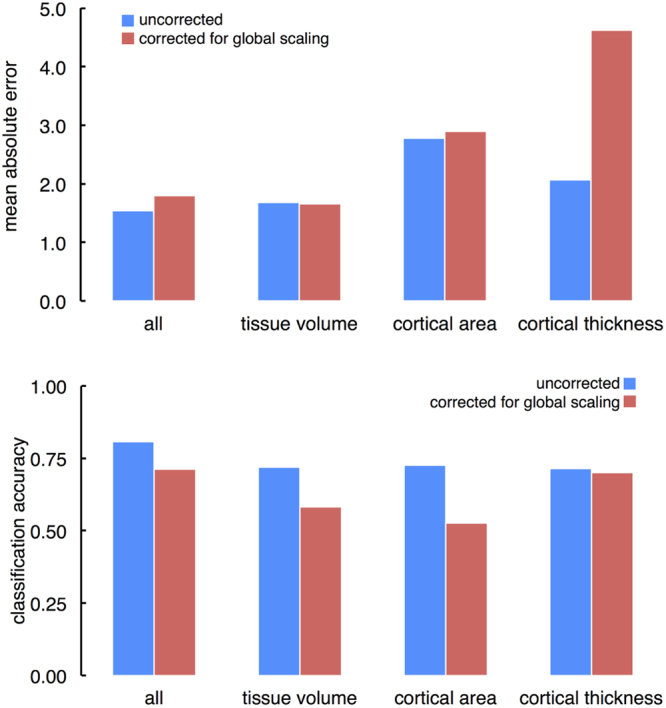
Brain development is a dynamic process with tissue-specific alterations that reflect complex and ongoing biological processes taking place during childhood and adolescence. Accurate identification and modelling of these anatomical processes in vivo with MRI may provide clinically useful imaging markers of individual variability in development. In this study, we use manifold learning to build a model of age- and sex-related anatomical variation using multiple magnetic resonance imaging metrics. Using publicly available data from a large paediatric cohort (n = 768), we apply a multi-metric machine learning approach combining measures of tissue volume, cortical area and cortical thickness into a low-dimensional data representation. We find that neuroanatomical variation due to age and sex can be captured by two orthogonal patterns of brain development and we use this model to simultaneously predict age with a mean error of 1.5-1.6 years and sex with an accuracy of 81%. We validate this model in an independent developmental cohort. We present a framework for modelling anatomical development during childhood using manifold embedding. This model accurately predicts age and sex based on image-derived markers of cerebral morphology and generalises well to independent populations.


Conflict of interest statement

The authors declare that they have no competing interests.

Figures

Figure 1
Figure 1
Neighbourhood preserving embedding. (A) For a given datapoint, Xi, nearest neighbours are selected and weights assigned that can be used to approximately reconstruct Xi. A linear transformation, P, is then sought to project the data into a low-dimensional space while preserving the neighbourhood structure. (B) Possible supervision strategies for neighbourhood construction. In an unsupervised setting, neighbours are selected based on image similarity alone; alternatively, neighbours can be selected from within- or between-classes in order to maximise/minimise group differences in the manifold structure. Similarly, neighbours can be selected based on the weighted combination of image similarity and that of another subject-specific attribute (e.g.: age). (C) Analysis pipeline for NPE analysis. For each image metric, NPE is used for subspace projection, before the embedded data are combined and passed on for statistical modelling.
Figure 2
Figure 2
Manifold structure for tissue volume, cortical area and cortical thickness. Manifold structure is visualised for tissue volume (A), cortical area (B) and cortical thickness (C). For each image metric, the first two embedding coordinates are plotted against each other. Each point represents a subject; the colourbar indicates age and markers denote sex (square: male; circle: female). Images show the embedding vectors for the first and second coordinates, i.e.: the model coefficients in each voxel required to transform data into the embedded subspace. Maps are Z-scored for comparison (colourbar).
Figure 3
Figure 3
Age and sex prediction with manifold embedding. (A) The first two coordinates of the joint manifold are shown, each point represents a subject; the colourbar indicates age and markers denote sex (square: male; circle: female). (B) Using 10-fold cross-validation, age and sex were predicted based on the concatenated manifold coordinates. Gaussian Process regression was used to predict age, shown plotted against chronological age (colourbar shown as in A). (C) Predicted class probabilities are shown for males (blue histogram) and females (yellow). (D) Predicted age error is shown for each site in PING separately. (E) Sex classification accuracies for each site in PING.
Figure 4
Figure 4
Age and sex prediction after correction for global scaling. (Top) Mean absolute error for the full manifold and for each imaging metric are shown before and after correction for individual differences in global scale. (Bottom) Corresponding sex classification accuracies for the full manifold and for each imaging metric.

References

    1. Dekaban, A. S. & Sadowsky, D. Changes in brain weights during the span of human life: relation of brain weights to body heights and body weights. Ann. Neurol.4, 345–356 (1978). - PubMed
    1. Yakovlev, P. I. & Lecours, A. R. The myelogenetic cycles of regional maturation of the brain. In Regional Development of the Brain in Early Life 3–69 (Blackwell, 1967).
    1. Huttenlocher PR. Synaptic density in human frontal cortex - developmental changes and effects of aging. Brain Res. 1979;163:195–205. doi: 10.1016/0006-8993(79)90349-4. - DOI - PubMed
    1. Mills KL, et al. Structural brain development between childhood and adulthood: Convergence across four longitudinal samples. NeuroImage. 2016;141:273–281. doi: 10.1016/j.neuroimage.2016.07.044. - DOI - PMC - PubMed
    1. Tamnes CK, et al. Brain development and aging: Overlapping and unique patterns of change. NeuroImage. 2013;68:63–74. doi: 10.1016/j.neuroimage.2012.11.039. - DOI - PMC - PubMed

Publication types

LinkOut - more resources