. 2017 Dec 5:11:567.
doi: 10.3389/fnhum.2017.00567. eCollection 2017.

Longitudinal Diffusion Tensor Imaging-Based Assessment of Tract Alterations: An Application to Amyotrophic Lateral Sclerosis

Affiliations

Longitudinal Diffusion Tensor Imaging-Based Assessment of Tract Alterations: An Application to Amyotrophic Lateral Sclerosis

Dobri Baldaranov et al. Front Hum Neurosci. .

Abstract

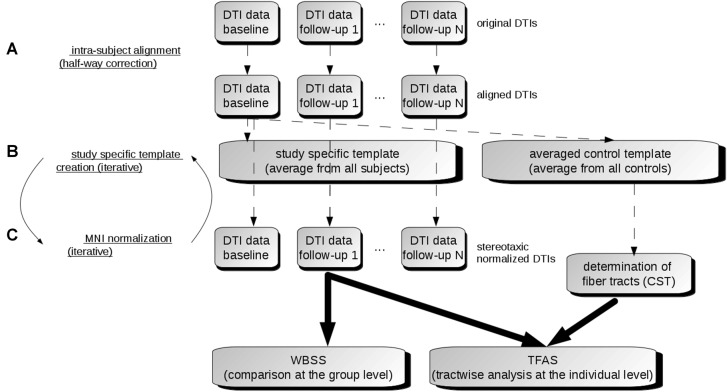
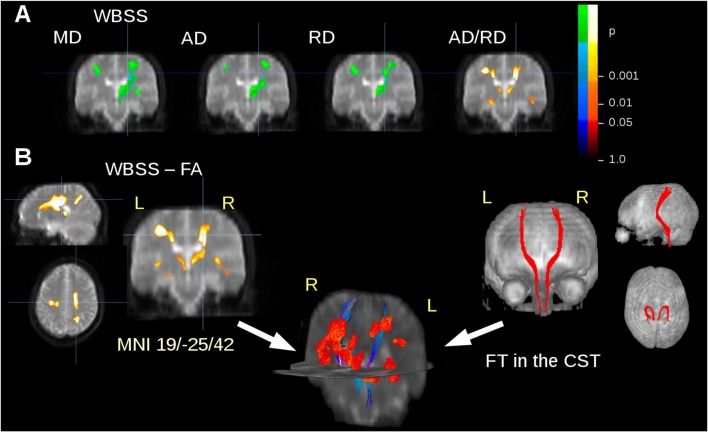
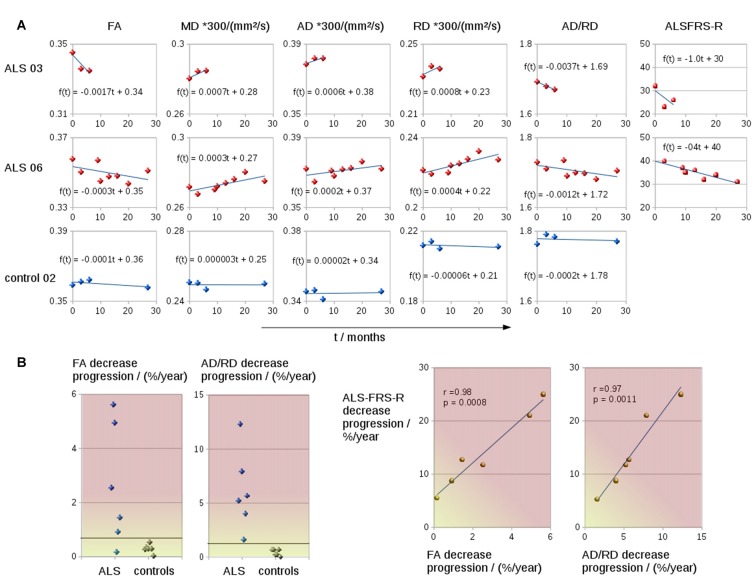
Objective: The potential of magnetic resonance imaging (MRI) as a technical biomarker for cerebral microstructural alterations in neurodegenerative diseases is under investigation. In this study, a framework for the longitudinal analysis of diffusion tensor imaging (DTI)-based mapping was applied to the assessment of predefined white matter tracts in amyotrophic lateral sclerosis (ALS), as an example for a rapid progressive neurodegenerative disease. Methods: DTI was performed every 3 months in six patients with ALS (mean (M) = 7.7; range 3 to 15 scans) and in six controls (M = 3; range 2-5 scans) with the identical scanning protocol, resulting in a total of 65 longitudinal DTI datasets. Fractional anisotropy (FA), mean diffusivity (MD), axonal diffusivity (AD), radial diffusivity (RD), and the ratio AD/RD were studied to analyze alterations within the corticospinal tract (CST) which is a prominently affected tract structure in ALS and the tract correlating with Braak's neuropathological stage 1. A correlation analysis was performed between progression rates based on DTI metrics and the revised ALS functional rating scale (ALS-FRS-R). Results: Patients with ALS showed an FA and AD/RD decline along the CST, while DTI metrics of controls did not change in longitudinal DTI scans. The FA and AD/RD decrease progression correlated significantly with ALS-FRS-R decrease progression. Conclusion: On the basis of the longitudinal assessment, DTI-based metrics can be considered as a possible noninvasive follow-up marker for disease progression in neurodegeneration. This finding was demonstrated here for ALS as a fast progressing neurodegenerative disease.

Keywords: DTI metrics; diffusion tensor imaging; magnetic resonance imaging; neurodegeneration; neurodegenerative disease.


Figures

Figure 1
Figure 1
Data analysis scheme. (A) In order to obtain a common coordinate frame, all diffusion tensor imaging (DTI) data (b0) were aligned to baseline data. From these b0, a subject-specific template was created for each subject separately. In the next step, b0 of baseline and follow-ups were aligned to the subject-specific template. (B) After creation of a study-specific template in the Montreal Neurological Institute (MNI) coordinate frame, DTI data of all visits were stereotaxically normalized (C). DTI metrics maps were calculated from normalized DTI data. Then, the voxelwise statistical comparison between the patients and the control group was performed. After averaging controls’ data sets, fiber tracts were calculated from this averaged data set. Finally, tractwise fractional anisotropy statistics (TFAS) was applied.
Figure 2
Figure 2
DTI metrics alterations at the group level. (A) Whole brain-based spatial statistics (WBSS) of the comparison amyotrophic lateral sclerosis (ALS) patients vs. controls: results clusters of mean diffusivity (MD), axial diffusivity (AD), radial diffusivity (RD), and the ratio AD/RD for coronal slice at y = −25. (B) Results clusters for Fractional anisotropy (FA) maps (as an example representative for all calculated DTI metrics) and projectional views of fiber tracking (FT) of the corticospinal tract (CST). Overlap of fiber tracts along the CST and FA differences at the group level in 3-D view. Increase is displayed in cold colors, decrease is displayed in hot colors.
Figure 3
Figure 3
(A) Charts of DTI metrics (FA, MD, AD, RD, the ratio AD/RD) and ALS-FRS-R alterations during the course of disease of two representative ALS patients (one fast progressor, one slow progressor) and one representative control. (B) FA and AD/RD decrease progression in the CST for six ALS patients and six controls. FA and AD/RD decrease progression correlated significantly with ALSFRS-R decrease.

References

    1. Abhinav K., Yeh F. C., El-Dokla A., Ferrando L. M., Chang Y. F., Lacomis D., et al. . (2014). Use of diffusion spectrum imaging in preliminary longitudinal evaluation of amyotrophic lateral sclerosis: development of an imaging biomarker. Front. Hum. Neurosci. 8:270. 10.3389/fnhum.2014.00270 - DOI - PMC - PubMed
    1. Agosta F., Chiò A., Cosottini M., De Stefano N., Falini A., Mascalchi M., et al. . (2010). The present and the future of neuroimaging in amyotrophic lateral sclerosis. AJNR Am. J. Neuroradiol. 31, 1769–1777. 10.3174/ajnr.A2043 - DOI - PMC - PubMed
    1. Agosta F., Weiler M., Filippi M. (2015). Propagation of pathology through brain networks in neurodegenerative diseases: from molecules to clinical phenotypes. CNS Neurosci. Ther. 21, 754–767. 10.1111/cns.12410 - DOI - PMC - PubMed
    1. Bede P., Hardiman O. (2014). Lessons of ALS imaging: pitfalls and future directions—a critical review. Neuroimage Clin. 4, 436–443. 10.1016/j.nicl.2014.02.011 - DOI - PMC - PubMed
    1. Braak H., Braak E. (1991). Neuropathological stageing of Alzheimer-related changes. Acta Neuropathol. 82, 239–259. 10.1007/bf00308809 - DOI - PubMed

LinkOut - more resources