. 2017 Dec 5:8:2399.
doi: 10.3389/fmicb.2017.02399. eCollection 2017.

Molecular Evolution of the VP1 Gene in Human Norovirus GII.4 Variants in 1974-2015

Affiliations

Molecular Evolution of the VP1 Gene in Human Norovirus GII.4 Variants in 1974-2015

Takumi Motoya et al. Front Microbiol. .

Abstract

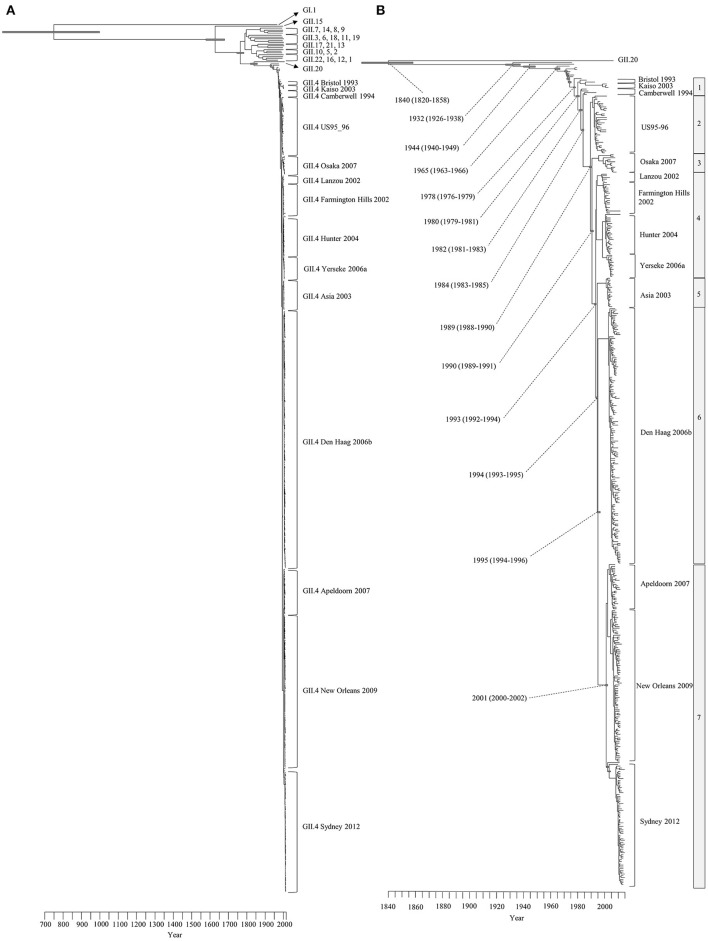
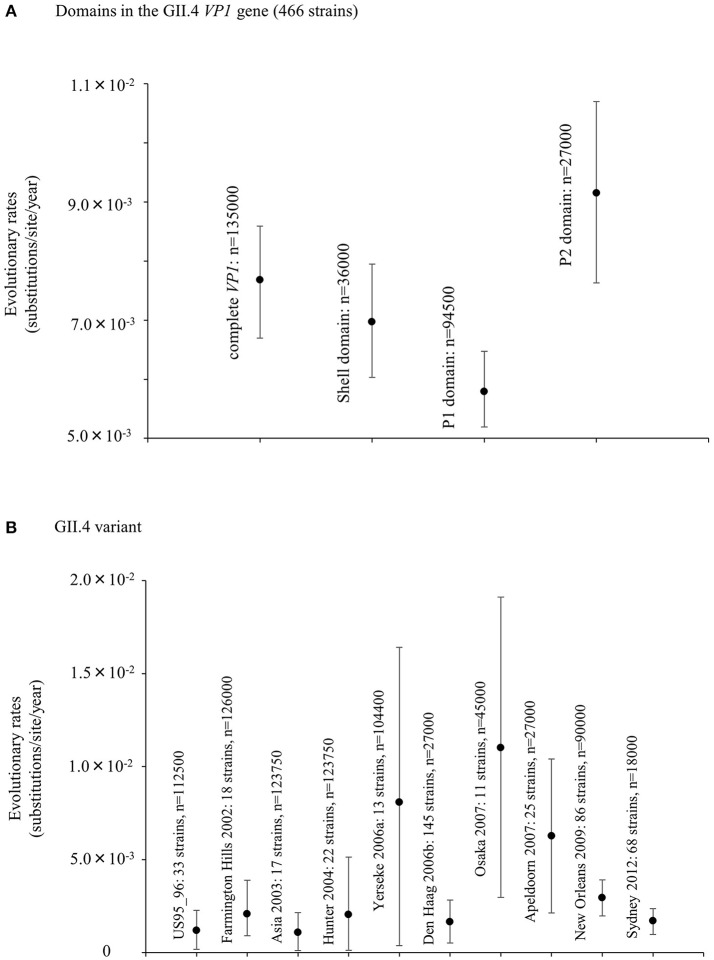
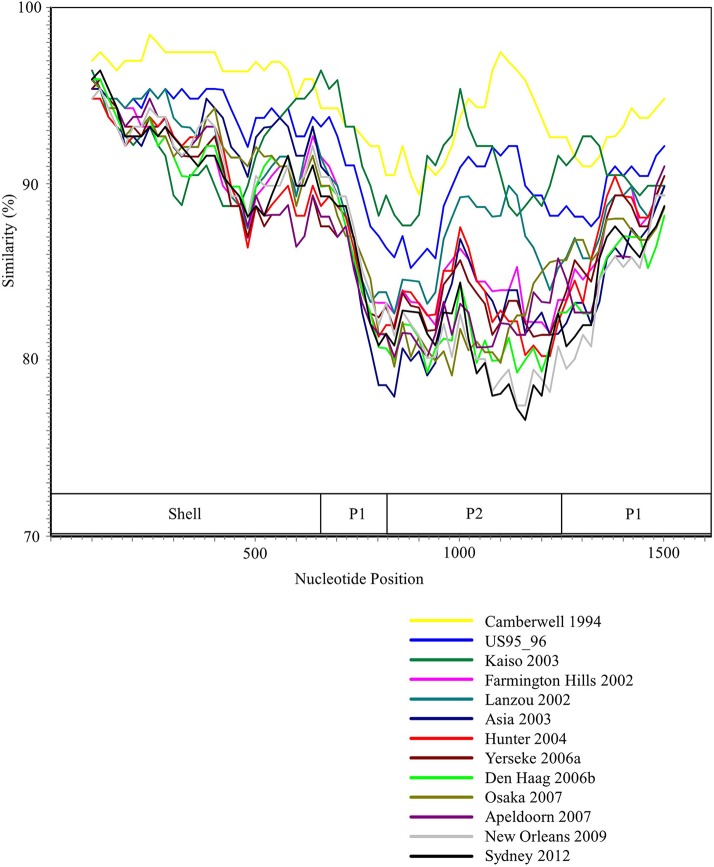
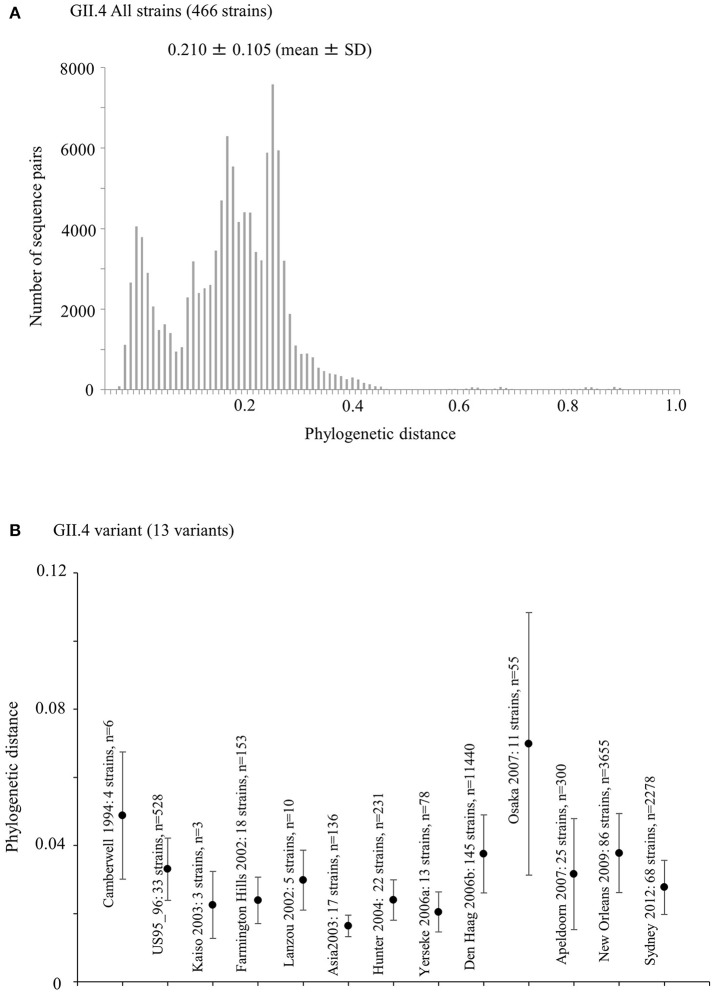
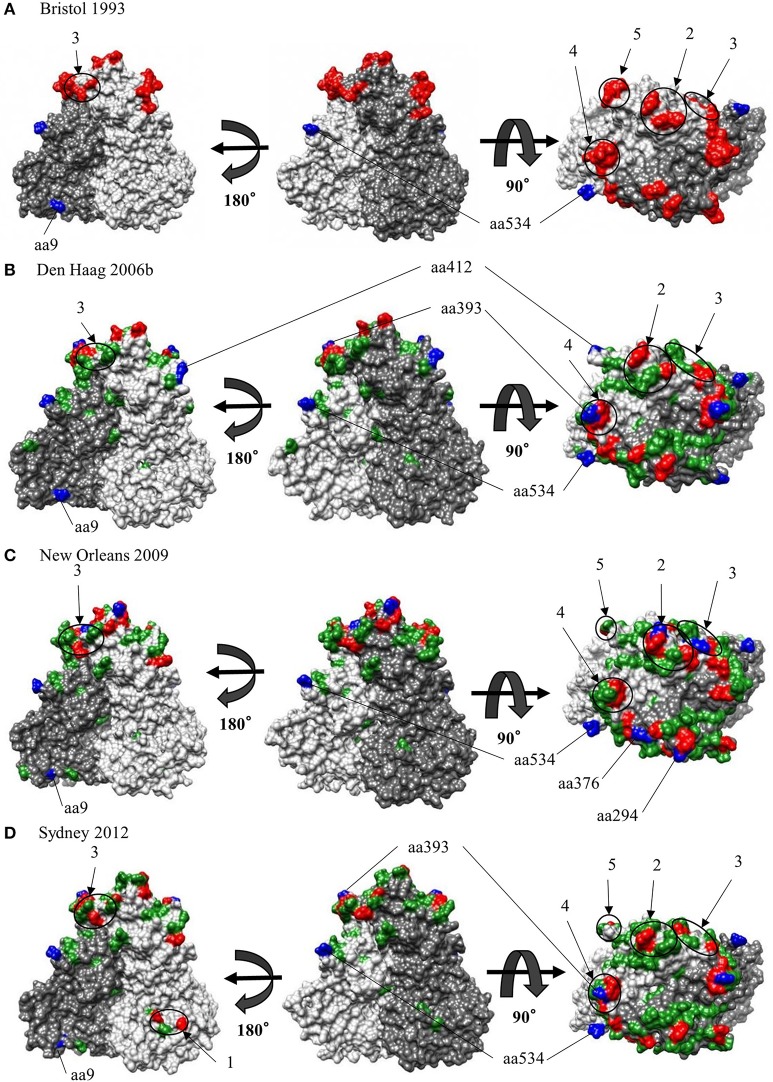
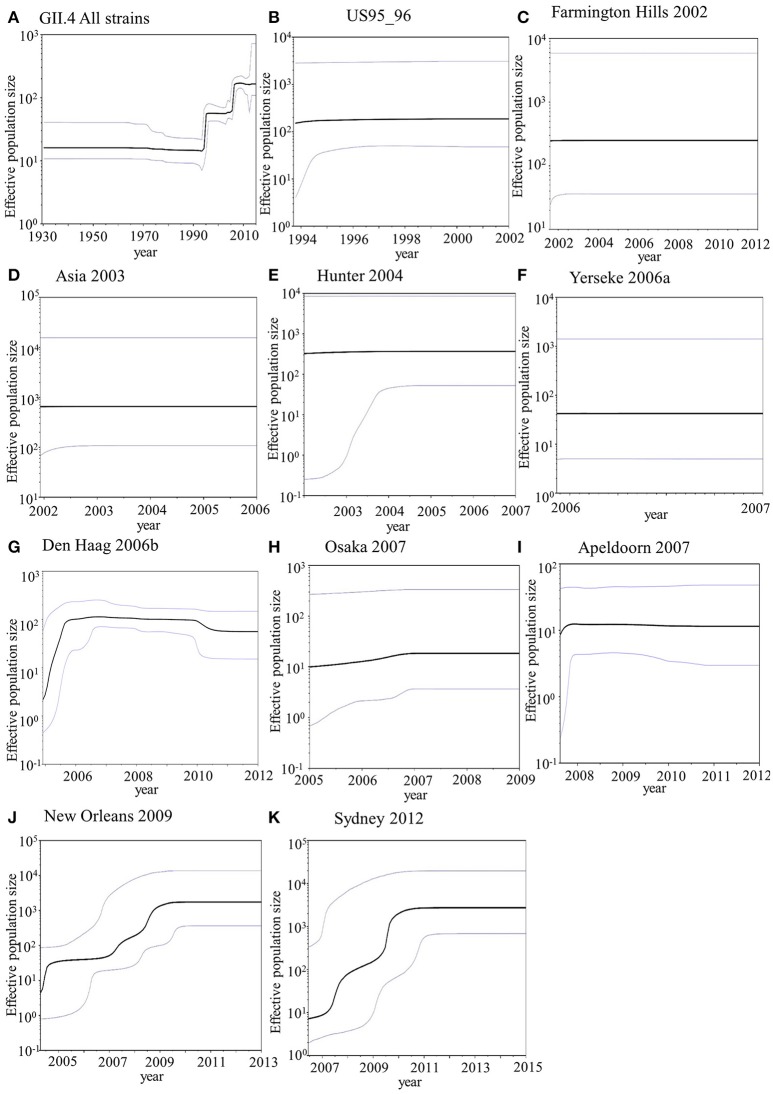
Human norovirus (HuNoV) is a leading cause of viral gastroenteritis worldwide, of which GII.4 is the most predominant genotype. Unlike other genotypes, GII.4 has created various variants that escaped from previously acquired immunity of the host and caused repeated epidemics. However, the molecular evolutionary differences among all GII.4 variants, including recently discovered strains, have not been elucidated. Thus, we conducted a series of bioinformatic analyses using numerous, globally collected, full-length GII.4 major capsid (VP1) gene sequences (466 strains) to compare the evolutionary patterns among GII.4 variants. The time-scaled phylogenetic tree constructed using the Bayesian Markov chain Monte Carlo (MCMC) method showed that the common ancestor of the GII.4 VP1 gene diverged from GII.20 in 1840. The GII.4 genotype emerged in 1932, and then formed seven clusters including 14 known variants after 1980. The evolutionary rate of GII.4 strains was estimated to be 7.68 × 10⁻³ substitutions/site/year. The evolutionary rates probably differed among variants as well as domains [protruding 1 (P1), shell, and P2 domains]. The Osaka 2007 variant strains probably contained more nucleotide substitutions than any other variant. Few conformational epitopes were located in the shell and P1 domains, although most were contained in the P2 domain, which, as previously established, is associated with attachment to host factors and antigenicity. We found that positive selection sites for the whole GII.4 genotype existed in the shell and P1 domains, while Den Haag 2006b, New Orleans 2009, and Sydney 2012 variants were under positive selection in the P2 domain. Amino acid substitutions overlapped with putative epitopes or were located around the epitopes in the P2 domain. The effective population sizes of the present strains increased stepwise for Den Haag 2006b, New Orleans 2009, and Sydney 2012 variants. These results suggest that HuNoV GII.4 rapidly evolved in a few decades, created various variants, and altered its evolutionary rate and antigenicity.

Keywords: GII.4; Norovirus; VP1; bioinformatics; molecular evolution.


Figures

Figure 1
Figure 1
Time-scaled phylogenetic trees of the complete HuNoV capsid VP1 gene constructed by the Bayesian MCMC method. (A) The maximum clade credibility tree with the dataset including HuNoV GI.1 and all GII genotypes; (B) Enlarged tree focused on GII.4. Gray bars indicate the 95% highest probability densities for each branch year.
Figure 2
Figure 2
Evolutionary rates of nucleotide sequences in the full-length GII.4 VP1 gene. (A) Evolutionary rates for domains within GII.4 VP1 gene; (B) Evolutionary rates for each GII.4 variant. The y-axis represents the evolutionary rate (substitutions/site/year). Statistical results for multiple comparisons in the domains and the GII.4 variants were shown in Tables S2, S3, respectively.
Figure 3
Figure 3
SimPlot analysis of the representative HuNoV GII.4 strains. Each variant's similarity to the Bristol 1993 variant is represented. The positions of the shell, P1, and P2 domains in VP1 gene are shown below the graph.
Figure 4
Figure 4
Phylogenetic distance between the nucleotide GII.4 sequences of the full-length VP1 gene. (A) Phylogenetic distance of intra-genotype in HuNoV GII.4 strains. The y-axis represents the number of sequence pairs corresponding to each distance. The x-axis shows phylogenetic distances; (B) Phylogenetic distance of intra-variant in HuNoV GII.4 strains. The y-axis indicates phylogenetic distances. The x-axis represents each variant. Data are expressed as mean ± standard deviation. Statistical results for multiple comparisons were shown in Table S4.
Figure 5
Figure 5
Structural models for the capsid VP1 protein of each HuNoV GII.4 variant. Three-dimensional VP1 dimer structures for the Bristol 1993 (A), the Den Haag 2006b (B), the New Orleans 2009 (C) and the Sydney 2012 (D) variants are shown. Chains that are composed of the dimer structures are colored in gray (chain A) and dim gray (chain B). Predicted epitopes of each variant are colored in red and circled for regions. Positive selection sites are colored in blue for aa9, aa294, aa376, aa393, aa412, and aa534. Of note, aa6 could not be specified due to lack of structure modeling in N terminus. Amino-acid substitutions of the other variants to a GII.4 Bristol 1993 strain are colored in green.
Figure 6
Figure 6
Bayesian skyline plot for VP1 sequences of HuNoV GII.4. Plots for all GII.4 strains (A), US95_96 variant strains (B), Farmington Hills 2002 variant strains (C), Asia 2003 variant strains (D), Hunter 2004 variant strains (E), Yerseke 2006a variant strains (F), Den Haag 2006 variant strains (G), Osaka 2007 variant strains (H), Apeldoorn 2007 variant strains (I), New Orleans 2009 variant strains (J), and Sydney 2012 variant strains (K) are shown. The y-axis represents the effective population size on logarithmic scale, whereas the x-axis denotes the time in years. The solid black line indicates the median posterior value. The intervals with the highest probability densities (95%) are shown by blue lines.

Similar articles

Cited by

References

    1. Añez G., Grinev A., Chancey C., Ball C., Akolkar N., Land K. J., et al. . (2013). Evolutionary dynamics of West Nile virus in the United States, 1999-2011: phylogeny, selection pressure and evolutionary time-scale analysis. PLoS Negl. Trop. Dis. 7:e2245. 10.1371/journal.pntd.0002245 - DOI - PMC - PubMed
    1. Allen D. J., Adams N. L., Aladin F., Harris J. P., Brown D. W. (2014). Emergence of the GII-4 Norovirus Sydney2012 Strain in England, Winter 2012-2013. PLoS ONE 9:e88978. 10.1371/journal.pone.0088978 - DOI - PMC - PubMed
    1. Allen D. J., Gray J. J., Gallimore C. I., Xerry J., Iturriza-Gómara M. (2008). Analysis of amino acid variation in the P2 domain of the GII-4 norovirus VP1 protein reveals putative variant-specific epitopes. PLoS ONE 3:e1485. 10.1371/journal.pone.0001485 - DOI - PMC - PubMed
    1. Allen D. J., Trainor E., Callaghan A., O'Brien S. J., Cunliffe N. A., Iturriza-Gómara M. (2016). Early detection of epidemic GII-4 norovirus strains in UK and Malawi: role of surveillance of sporadic acute gastroenteritis in anticipating global epidemics. PLoS ONE 11:e0146972. 10.1371/journal.pone.0146972 - DOI - PMC - PubMed
    1. Andernach I. E., Hunewald O. E., Muller C. P. (2013). Bayesian inference of the evolution of HBV/E. PLoS ONE 8:e81690. 10.1371/journal.pone.0081690 - DOI - PMC - PubMed