. 2017 Dec 5:8:2008.
doi: 10.3389/fpls.2017.02008. eCollection 2017.

A Larger Chocolate Chip-Development of a 15K Theobroma cacao L. SNP Array to Create High-Density Linkage Maps

Affiliations

A Larger Chocolate Chip-Development of a 15K Theobroma cacao L. SNP Array to Create High-Density Linkage Maps

Donald Livingstone 3rd et al. Front Plant Sci. .

Erratum in

Abstract

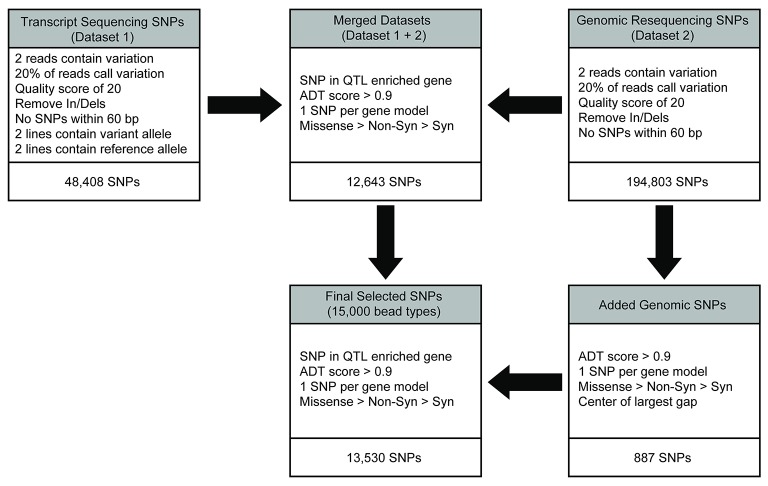
Cacao (Theobroma cacao L.) is an important cash crop in tropical regions around the world and has a rich agronomic history in South America. As a key component in the cosmetic and confectionary industries, millions of people worldwide use products made from cacao, ranging from shampoo to chocolate. An Illumina Infinity II array was created using 13,530 SNPs identified within a small diversity panel of cacao. Of these SNPs, 12,643 derive from variation within annotated cacao genes. The genotypes of 3,072 trees were obtained, including two mapping populations from Ecuador. High-density linkage maps for these two populations were generated and compared to the cacao genome assembly. Phenotypic data from these populations were combined with the linkage maps to identify the QTLs for yield and disease resistance.

Keywords: QTL; SNP; cacao; genotyping.


Figures

Figure 1
Figure 1
SNP discovery and filtering to select the 13,530 SNPs for inclusion on the Cacao15kSNP array. The transcript (dataset 1) and genomic resequencing (dataset 2) variants were identified by alignment to the early Matina reference genome. Initial filtering was applied to provide confidence in the existence of variants. The two variant sets were combined into the merged dataset, and filtering was applied to reduce the number of SNPs by enriching for markers within the QTL regions, identifying those SNPs most likely to perform well on the chip (ADT score), and selecting for SNPs that represented the most genes possible. SNPs were added from the genomic resequencing data (dataset 2) to reach the targeted number of markers in the final filtered SNPs for inclusion on the Cacao15kSNP array.
Figure 2
Figure 2
Comparison of SNP locations in the Matina 1-6 genome. The chromosomes (TcmChr) and unanchored scaffolds (TcmScaf) of the Matina 1-6 v1.1 genome assembly are presented as concentric circles composed of colored arcs with their physical size in Mbp indicated. The outer circle comprises the 10 chromosomes, while the unanchored scaffolds are the inner circle. The location of the enriched QTL regions used in SNP selection are shaded in gray. Colored tick marks represent the SNPs selected for inclusion on the Cacao15kSNP array (green tick marks), SNPs present on the Cacao6kSNP array (blue tick marks), and SNPs in common between the two arrays (purple tick marks).
Figure 3
Figure 3
A comparison of the Matina 1-6 genome assembly and the two Stalin linkage maps. SNP marker position is compared across the Matina 1-6 genome assembly and the (A) Stalin A and (B) Stalin B genetic maps. The Stalin A linkage groups are designated by StA and the corresponding linkage group number. The Stalin B linkage groups are designated by StB and the corresponding linkage group number. Chromosomes from the Matina assembly are denoted with TcmChr. Unanchored scaffolds in the Matina assembly are identified as TcmScaf 11, TcmScaf 12, TcmScaf 13, and TcmScaf 26. Each linkage group is identified by a unique color. SNPs positioned on the Matina assembly are connected by a line to their corresponding locations within the linkage map.
Figure 4
Figure 4
QTL mapping of the Stalin A population. Each chromosome is represented as a separate plot with the x-axis showing the marker position (cM) along the chromosome and the y-axis showing the −log10(p) value. Higher −log10(p) values indicate stronger associations. The values above a threshold −log10(p) value of 3.7 (dashed line) are considered significant. Six traits are represented: cherelle wilt ratio (upper left), probability of monilia infection (middle left), percent of sick pods (lower left), fresh weight (upper right), number of total pods (middle right), and fresh weight per pod (lower right).
Figure 5
Figure 5
QTL mapping of the Stalin B population. Each chromosome is represented as a separate plot with the x-axis showing the marker position (cM) along the chromosome and the y-axis showing the −log10(p) value. Higher −log10(p) values indicate stronger associations. The values above a threshold −log10(p) value of 3.6 (dashed line) are considered significant. Two traits are represented: fresh weight (left) and fresh weight per pod (right).

References

    1. Akond M., Liu S., Schoener L., Anderson J., Kantartzi S. K., Meksem K., et al. (2013). A SNP-Based genetic linkage map of soybean using the SoySNP6K illumina infinium BeadChip genotyping array. Plant Genet. Genomics Biotechnol. 1, 80–89. 10.5147/jpgs.2013.0090 - DOI
    1. Allegre M., Argout X., Boccara M., Fouet O., Roguet Y., Bérard A., et al. . (2012). Discovery and mapping of a new expressed sequence tag-single nucleotide polymorphism and simple sequence repeat panel for large-scale genetic studies and breeding of Theobroma cacao L. DNA Res. 19, 23–35. 10.1093/dnares/dsr039 - DOI - PMC - PubMed
    1. Argout X., Salse J., Aury J. M., Guiltinan M. J., Droc G., Gouzy J., et al. . (2011). The genome of Theobroma cacao. Nat. Genet. 43, 101–108. 10.1038/ng.736 - DOI - PubMed
    1. Bartley B. G. D. (2005). The Genetic Diversity of Cacao and its Utilization. Wallingford: CABI Publishing.
    1. Borrone J., Kuhn D., Schnell R. (2004). Isolation, characterization, and development of WRKY genes as useful genetic markers in Theobroma cacao. Theor. Appl. Genet. 109, 495–507. 10.1007/s00122-004-1662-4 - DOI - PubMed