

Effects of acute exposure to low-dose radiation on the characteristics of human bone marrow mesenchymal stromal/stem cells
- PMID: 29259718
- PMCID: PMC5725824
- DOI: 10.1186/s41232-017-0049-2
Effects of acute exposure to low-dose radiation on the characteristics of human bone marrow mesenchymal stromal/stem cells
Abstract
Background: In recent years, increasing attention has been paid to the effects of low-dose irradiation on human health. We examined whether low-dose irradiation affected the functions of mesenchymal stromal/stem cells (MSCs), which are tissue/organ-supportive stem cells, derived from bone marrow (BM).
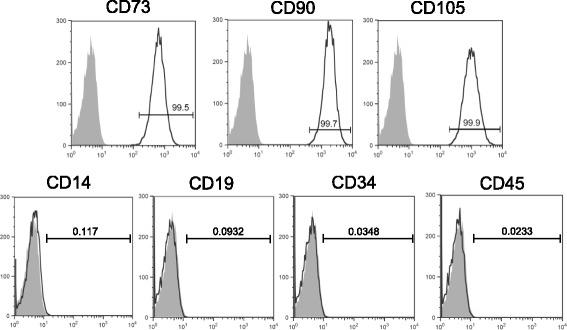
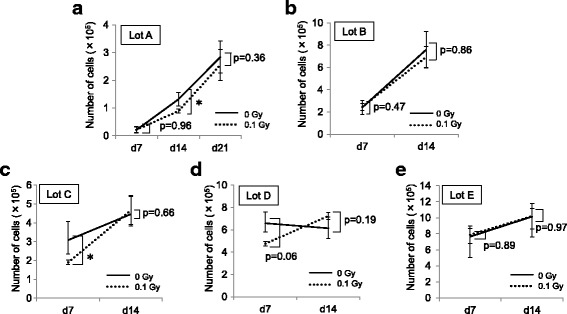
Methods: Normal human BM-MSCs from five healthy individuals were used in this study. Culture-expanded BM-MSCs were exposed to 0.1 gray (Gy) of γ-radiation (Cesium-137) at a rate of 0.8 Gy/min (Ir-MSCs), and their expansion, multi-differentiation, and hematopoiesis-supportive capabilities were investigated.
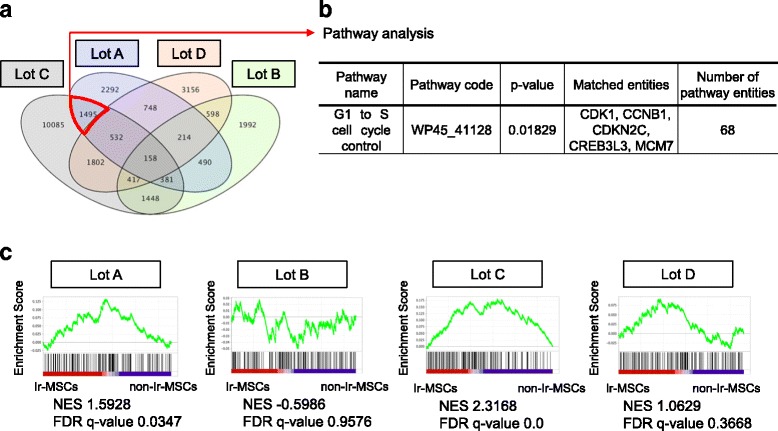
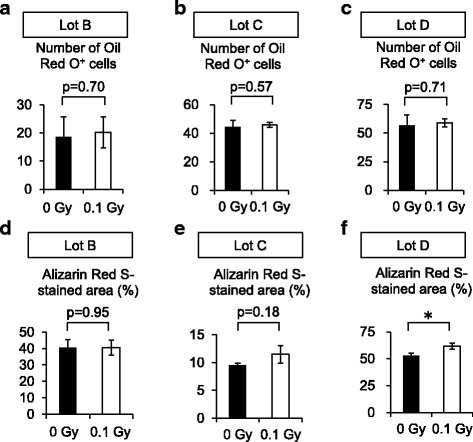
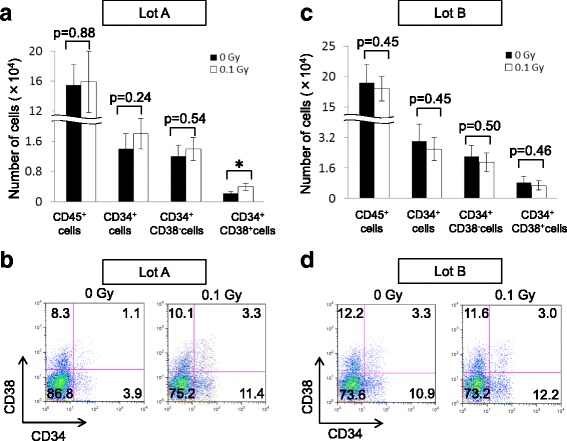
Results: The expansion of BM-MSCs was transiently delayed after low-dose γ-irradiation compared with that of non-irradiated BM-MSCs (non-Ir-MSCs) in two out of five lots. Adipogenic and osteogenic differentiation capabilities were not significantly affected by low-dose irradiation, although one lot of BM-MSCs tended to have transiently reduced differentiation. When human BM hematopoietic stem/progenitor cells (HPCs) were co-cultured with Ir-MSCs, the generation of CD34+CD38+ cells from HPCs was enhanced compared with that in co-cultures with non-Ir-MSCs in two out of five lots. The mRNA expression level of interleukin (IL)-6 was increased and those of stem cell factor (SCF) and fms-related tyrosine kinase 3 ligand (Flt3L) were decreased in the affected lots of Ir-MSCs. In the other three lots of BM-MSCs, a cell growth delay, enhanced generation of CD34+CD38+ cells from HPCs in co-culture, and a combination of increased expression of IL-6 and decreased expression of SCF and Flt3L were not observed. Of note, the characteristics of these affected Ir-MSCs recovered to a similar level as those of non-Ir-MSCs following culture for 3 weeks.
Conclusions: Our results suggest that acute exposure to low-dose (0.1 Gy) radiation can transiently affect the functional characteristics of human BM-MSCs.
Keywords: Bone marrow mesenchymal stromal/stem cells; Human; Low-dose irradiation.
Conflict of interest statement
BM samples from healthy adult volunteers were purchased from AllCells (Emeryville, CA). Ethical approval and consent to participate are not applicable.Not applicable.The authors declare no conflicts of interest.Springer Nature remains neutral with regard to jurisdictional claims in published maps and institutional affiliations.
Figures


Similar articles
-
Impact of 2 Gy γ-irradiation on the hallmark characteristics of human bone marrow-derived MSCs.Int J Hematol. 2021 May;113(5):703-711. doi: 10.1007/s12185-020-03072-9. Epub 2021 Jan 1. Int J Hematol. 2021. PMID: 33386593
-
P27 deletion enhances hematopoiesis by paracrine action of IL22 secreted from bone marrow mesenchymal stem cells.Am J Transl Res. 2020 Mar 15;12(3):787-799. eCollection 2020. Am J Transl Res. 2020. PMID: 32269712 Free PMC article.
-
Menatetrenone facilitates hematopoietic cell generation in a manner that is dependent on human bone marrow mesenchymal stromal/stem cells.Int J Hematol. 2020 Sep;112(3):316-330. doi: 10.1007/s12185-020-02916-8. Epub 2020 Jun 22. Int J Hematol. 2020. PMID: 32572826
-
Parathyroid hormone enhances hematopoietic expansion via upregulation of cadherin-11 in bone marrow mesenchymal stromal cells.Stem Cells. 2014 Aug;32(8):2245-55. doi: 10.1002/stem.1701. Stem Cells. 2014. PMID: 24648356
-
The Particle Radiobiology of Multipotent Mesenchymal Stromal Cells: A Key to Mitigating Radiation-Induced Tissue Toxicities in Cancer Treatment and Beyond?Front Oncol. 2021 Apr 12;11:616831. doi: 10.3389/fonc.2021.616831. eCollection 2021. Front Oncol. 2021. PMID: 33912447 Free PMC article. Review.
Cited by
-
Hematopoietic Stem Cells and Mesenchymal Stromal Cells in Acute Radiation Syndrome.Oxid Med Cell Longev. 2020 Aug 8;2020:8340756. doi: 10.1155/2020/8340756. eCollection 2020. Oxid Med Cell Longev. 2020. PMID: 32855768 Free PMC article. Review.
-
Ultralow-dose irradiation enables engraftment and intravital tracking of disease initiating niches in clonal hematopoiesis.Sci Rep. 2024 Sep 3;14(1):20486. doi: 10.1038/s41598-024-71307-4. Sci Rep. 2024. PMID: 39227700 Free PMC article.
-
Organ-Specific Effects of Low Dose Radiation Exposure: A Comprehensive Review.Front Genet. 2020 Oct 2;11:566244. doi: 10.3389/fgene.2020.566244. eCollection 2020. Front Genet. 2020. PMID: 33133150 Free PMC article. Review.
-
Cell-based and extracellular vesicle-based MSC therapies for acute radiation syndrome affecting organ systems.J Radiat Res. 2024 Dec 16;65(Supplement_1):i80-i87. doi: 10.1093/jrr/rrae009. J Radiat Res. 2024. PMID: 39679884 Free PMC article. Review.
-
Impact of 2 Gy γ-irradiation on the hallmark characteristics of human bone marrow-derived MSCs.Int J Hematol. 2021 May;113(5):703-711. doi: 10.1007/s12185-020-03072-9. Epub 2021 Jan 1. Int J Hematol. 2021. PMID: 33386593
References
-
- Little MP, Azizova TV, Bazyka D, Bouffler DS, Cardis E, Chekin S, et al. Systematic review and meta-analysis of circulatory disease from exposure to low-level ionizing radiation and estimates of potential population mortality risks. Environ Health Perspect. 2012;120:1503–1511. doi: 10.1289/ehp.1204982. - DOI - PMC - PubMed
-
- Leuraud K, Richardson DB, Cardis E, Daniels RD, Gillies M, O’Hagan JA, et al. Ionising radiation and risk of death from leukaemia and lymphoma in radiation-monitored workers (INWORKS): an international cohort study. Lancet Haematol. 2015;2:e276–e281. doi: 10.1016/S2352-3026(15)00094-0. - DOI - PMC - PubMed
LinkOut - more resources
Full Text Sources
Other Literature Sources
Research Materials
Miscellaneous
