. 2018 Feb 22;554(7693):481-486.
doi: 10.1038/nature25453. Epub 2017 Dec 20.

Structure of the mechanically activated ion channel Piezo1

Affiliations

Structure of the mechanically activated ion channel Piezo1

Kei Saotome et al. Nature. .

Erratum in

Abstract

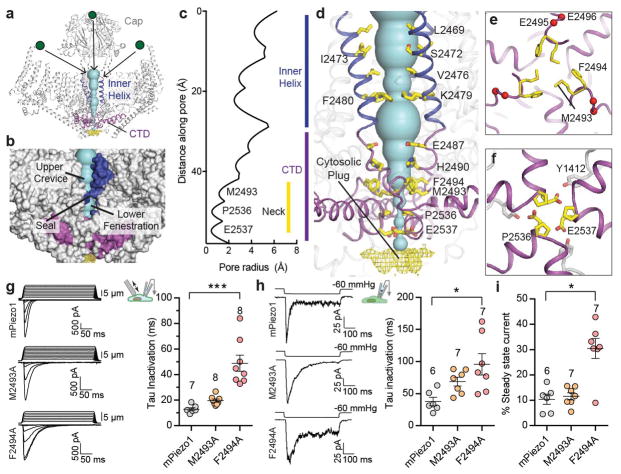
Piezo1 and Piezo2 are mechanically activated ion channels that mediate touch perception, proprioception and vascular development. Piezo proteins are distinct from other ion channels and their structure remains poorly defined, which impedes detailed study of their gating and ion permeation properties. Here we report a high-resolution cryo-electron microscopy structure of the mouse Piezo1 trimer. The detergent-solubilized complex adopts a three-bladed propeller shape with a curved transmembrane region containing at least 26 transmembrane helices per protomer. The flexible propeller blades can adopt distinct conformations, and consist of a series of four-transmembrane helical bundles that we term Piezo repeats. Carboxy-terminal domains line the central ion pore, and the channel is closed by constrictions in the cytosol. A kinked helical beam and anchor domain link the Piezo repeats to the pore, and are poised to control gating allosterically. The structure provides a foundation to dissect further how Piezo channels are regulated by mechanical force.


Conflict of interest statement

The authors declare no competing financial interests.

Figures

Extended Data Figure 1
Extended Data Figure 1. Purification and EM analysis of mPiezo1
a, Preparative gel filtration chromatogram of mPiezo1 after affinity purification and proteolytic removal of GST tag. b, SDS-PAGE analysis of mPiezo1 following affinity purification (Pre-SEC) and after subsequent SEC step (SEC Fractions). Purifications of mPiezo1 have been repeated more than three times with similar results. c, aligned micrograph of purified mPiezo1 embedded in a thin layer of vitrified ice. Scale bar represents 100 nm. d, Representative 2D classes of Piezo1 showing different particle orientations.
Extended Data Figure 2
Extended Data Figure 2. Classification and refinement Piezo1 core
a, Data processing flow chart. b, local resolution maps calculated by the locres program in RELION 2.0. Color key for local resolution (in Å) is shown. c, angular distributions of the particles after the final step of refinement in RELION. The radius of the sphere is proportional to the number of particles with a given orientation. Only one third of the sphere is shown due to applied C3 symmetry. d, FSC plots calculated using relion_postprocess for unmasked maps and maps with a soft mask applied to remove the contribution of scattered detergent density.
Extended Data Figure 3
Extended Data Figure 3. Asymmetry of Piezo1 and blade-focused classification and refinement
a, Duplicate unsharpened maps of Piezo1 refined without symmetry imposed, with the blue map rotated ~120° around the central axis of pseudosymmetry relative to the pink map, then superimposed with the “fit in map” function of UCSF chimera. Left panel shows top view, while right panel shows a horizontal slice through the transmembrane region. b, flow chart of propeller blade focused classification and refinement procedure. c, local resolution maps calculated by the locres program in RELION 2.0. Color key for local resolution (in Å) is shown and is the same as Extended Data Fig 2b. d, angular distributions of the particles after the final step of refinement in RELION. The radius of the sphere is proportional to the number of particles with a given orientation e, FSC plots calculated using relion_postprocess for unmasked maps and maps with a soft mask applied to remove the contribution of scattered detergent density.
Extended Data Figure 4
Extended Data Figure 4. Fit of molecular model to electron density
Select regions of the molecular model are shown as yellow cartoon, with superimposed electron density as blue mesh. The density is derived from the C3 symmetry core masked map for the top two rows, and derived from Blade Class 1 for the bottom row.
Extended Data Figure 5
Extended Data Figure 5. Structural comparisons of current and previous (EMDB 6343) mPiezo1 structures
For each panel, “fit in map” function of UCSF Chimera was used to align uncropped maps. In a–e, unsharpened map of C3 refinement is shown. a–c, top (a), bottom (b) and side (c) views of current mPiezo1 (green) and EMDB 6343 (gray) structurally aligned. d shows expanded top view of the cap domain to illustrate a ~15° rotation of the cap between the two maps. e shows expanded sliced top view of pore-proximal transmembrane region. Subtle conformational rearrangements are present between the current and previous structures in the inner and outer helices. f–g, top and side views of EMDB 6343 (gray), Blade Class 1 (blue), and Blade Class 2 (orange). Coarsely, the trajectories of the propeller blades are similar across the maps in both the membrane-parallel and membrane-normal directions.
Extended Data Figure 6
Extended Data Figure 6. Structural features of Piezo repeats
a, top view of Piezo1 depicted as cartoon, with amphipathic helices from Piezo Repeats A, B, C shown in red. Extracellular cap domain is omitted for clarity. b, c, d, ribbon models of amphipathic helices from Piezo Repeat A (b), Piezo Repeat B (c), and Piezo Repeat C (d). Cα positions are shown as spheres and hydrophobic amino acids are colored gray, basic amino acids are colored blue, acidic amino acids are colored red, and polar uncharged amino acids are colored yellow. e, cartoon model of a portion of the Piezo1 propeller blade, with Piezo Repeats colored separately. A strong density peak putatively representing a lipid head group is shown as pink mesh. f, Expanded view of the putative lipid binding site sandwiched between Piezo repeats B and C (helices B4 and C1). Electron density (blue mesh) is superimposed onto the molecular model, and the putative lipid head group is shown as pink mesh. Side chains contributing to the binding pocket are shown as yellow sticks and labeled.
Extended Data Figure 7
Extended Data Figure 7. Expression and functional properties of Piezo1 mutants
a, HEK293T P1KO cells expressing mPiezo1 M2493A/F2494A do not show discernible currents activated by indentation with blunt pipette (left) or stretch (right). b, FSEC traces of untransfected HEK293F cells (gray) or cells expressing C-terminal tdTomato fusions of wild-type mPiezo1 or mPiezo1 M2493A/F2494A injected into Superose 6 increase column. Similar to wild-type, the double mutant displays a single dominant peak eluting shortly after void volume, indicating proper trimeric expression. Data from one independent experiment. c, Representative images of Myc labeling in mPiezo1 IRES-GFP (top row), mPiezo1-myc IRES-GFP (middle row) or mPiezo1-myc M2493A/F2494A IRES-GFP (bottom row) transfected HEK293T P1KO cells. Myc tags were inserted at position 897. Immunostaining was performed before (left panels) or after (right panels) cell permeabilization. mPiezo1-myc M2493A/F2494A is labeled at the surface in live cells similar to mPiezo-1 myc, indicating that surface expression is preserved in the nonfunctional mutant. Scale bar, 10 μm. Experiments were repeated 3 times with reproducible results. d, Left, representative traces of stretch activated single channel currents recorded (−80mV) from HEK293T P1KO cells expressing wild type, M2493A or F2494A mPiezo1 channels (traces displayed after applying 1kHz digital filter). The corresponding pressure stimulus used to elicit the response is illustrated above the current trace. For each condition, the amplitude histogram for the corresponding trace is depicted on the right. The Gaussian fit for the closed (black curve) and open (red curve) components is overlaid on the histograms. e, Left, average I–V relationship of stretch activated single channel currents from wild type (N=4), M2493A (N=5) or F2494A (N=4) mPiezo1 channels. Amplitude was measured as a difference in Gaussian fits of full-trace histograms. Right, average unitary conductance calculated from the slope of linear regression line fit to individual cells in each condition. **P<0.01 One-way ANOVA with Dunn’s comparison relative to mPiezo1 f, Average I–V relationship curves of MA currents recorded from wild type (N=6), M2493A (N=8) or F2494A (N=9) mPiezo1 channels with 150mM CsCl-based intracellular solution and 100mM CaCl2-based extracellular solution. Currents were elicited from −69.6 to 50.4 mV (Δ20mV). Inset, expanded view of curves between 5 and 15mV. Values are mean ± s.e.m. g, Average reversal potential from individual cells;mPiezo1: 8.8±1.3 mV (n=6), M2493A: 10.2±1.2 mV (n=8) and F2494A: 13.5±0.5 mV (n=9). **P=0.0063 One-way ANOVA with Dunn’s comparison relative to mPiezo1. N=X individual cells.
Figure 1
Figure 1. Architecture and domain arrangement of the Piezo1 core
Side (a) and top (b) views of the Piezo1 cryo-EM map refined with C3 symmetry imposed. Density corresponding to modeled regions is colored green. Less resolved density that could not be modeled is colored yellow. At lower thresholds (transparent gray map), scattered density likely originating from detergent micelle can be observed. c, surface electrostatics of the Piezo1 core model. Note the bent hydrophobic stripe representing the transmembrane region. Dotted lines approximate the extracellular (black) and cytosolic (yellow) membrane boundaries. d, e, side (d) and top (e) views of the Piezo1 core in cartoon representation, with each domain colored differently. In e, the cap domain is removed to highlight domain swapping between Piezo Repeat A and outer helix. f, schematic of the Piezo1 core domain arrangement. Dotted lines represent flexible regions that were not clearly resolved in the density maps.
Figure 2
Figure 2. Propeller blade composition and conformational heterogeneity
a, b, side (a) and top (b) views of Blade Class1 EM map, with individual domains segmented and colored uniquely. In b, the map is sliced along the dotted line in a to highlight the positions of the TM helices. c, schematic of Piezo repeat topology, which includes a cytosolic membrane parallel helix and four TM helices. d, Aligned models for Piezo Repeats A (yellow), B (cyan), and C (pink). e, Sagittal slice of EM density corresponding to the transmembrane region of Blade Class 1 (blue) and Blade Class 2 (orange). Approximate trajectory of the beam is shown as pink dotted line. Individual Piezo Repeats are circled by black dotted lines and labeled A–F. Red double arrow depicts direction of conformational change between the two classes. f, Superposed EM maps and cartoon models corresponding to beam domains of Blade Class 1 (blue) and Blade Class 2 (orange). Cα positions of the conserved Ala-Ser-Arg-Gly motif at the beam pivot are shown as spheres.
Figure 3
Figure 3. Ion pore structure and electrophysiological characterization of M2493A and F2494A
a, cartoon model of Piezo1, with inner helix and CTD colored blue and purple, respectively. Flexible linkers between the cap domain and the transmembrane region are depicted as dotted lines. Green spheres represent ions, with possible entryways into the pore shown as black arrows. b, surface representation of transmembrane region of Piezo1 surrounding the central axis, highlighting lateral membrane openings to the pore pathway. c, van der Waals radii of the pore, plotted against distance along the pore axis. The radial distance between the pore axis and the protein surface is shown as cyan surface in a, b, and d. d, expanded view of the Piezo1 pore, with residues lining the pore pathway shown in yellow and labeled. EM density corresponding to a ‘cytosolic plug’ is shown as yellow mesh. e, f, expanded top-down views of constrictions formed by M2493 and F2494 (e) and P2536 and E2537 (f). Residues mentioned in the text are also labeled. g, Left, representative traces of probe displacement and MA whole-cell currents recorded (−80 mV) from one cell expressing wild type, M2493A or F2494A mPiezo1 channels. Right, inactivation time constant for individual cells across different conditions (mPiezo1 N=7 cells, M2493A N=8 cells and F2494A N=8 cells). h, Left, representative traces of stretch activated macroscopic currents recorded (−80mV) in response to −60 mmHg pressure from one cell expressing wild type, M2493A or F2494A mPiezo1 channels. Right, inactivation time constant (at −60mmHg) for individual cells across different conditions. i, Percent steady state current (at −60 mmHg) for individual cells across different conditions. hi, mPiezo1 N=7 cells, M2493A N=8 cells and F2494A N=8 cells. gi, whiskers represent mean±s.e.m.; One-way analysis of variance (ANOVA) with Dunn’s multiple comparison relative to mPiezo1. g ***P=0.0001, h *P=0.008 and i *P=0.012).
Figure 4
Figure 4. Interdomain interactions and lipid pocket
a shows cartoon model of Piezo1, with color-coded boxes around regions expanded in be. In a and d, red mesh shows EM density corresponding to putative lipid. In a–e, residues contributing to interdomain contacts (b, c, e) or putative lipid binding (d) are shown as sticks and colored according to domain.
Figure 5
Figure 5. Mapping of disease mutants and schematic diagram of Piezo1 structure and conformational flexibility
a, Model of the Piezo1 core, with Cα positions of Piezo1 and Piezo2 human GOF disease mutants shown as red spheres. b–d, schematic diagrams of the various Piezo1 structural elements that contribute to its function as a membrane-tension gated channel. In c and d, bottom-up (c) and top-down (d) views of a single Piezo1 propeller blade are shown, with dotted lines and arrows depicting lateral conformational flexibility, which may be involved in gating.

Comment in

References

    1. Ranade SS, Syeda R, Patapoutian A. Mechanically Activated Ion Channels. Neuron. 2015;87:1162–79. - PMC - PubMed
    1. Coste B, et al. Piezo1 and Piezo2 are essential components of distinct mechanically activated cation channels. Science. 2010;330:55–60. - PMC - PubMed
    1. Coste B, et al. Piezo proteins are pore-forming subunits of mechanically activated channels. Nature. 2012;483:176–81. - PMC - PubMed
    1. Ranade SS, et al. Piezo2 is the major transducer of mechanical forces for touch sensation in mice. Nature. 2014;516:121–U330. - PMC - PubMed
    1. Woo SH, et al. Piezo2 is the principal mechanotransduction channel for proprioception. Nature Neuroscience. 2015;18:1756–1762. - PMC - PubMed

Publication types