. 2017 Dec 20;12(12):e0189261.
doi: 10.1371/journal.pone.0189261. eCollection 2017.

Microbial cells can cooperate to resist high-level chronic ionizing radiation

Affiliations

Microbial cells can cooperate to resist high-level chronic ionizing radiation

Igor Shuryak et al. PLoS One. .

Abstract

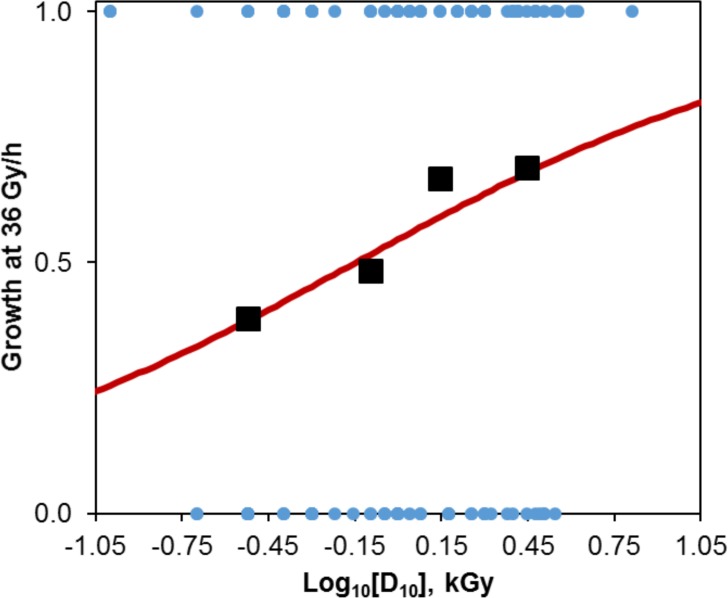
Understanding chronic ionizing radiation (CIR) effects is of utmost importance to protecting human health and the environment. Diverse bacteria and fungi inhabiting extremely radioactive waste and disaster sites (e.g. Hanford, Chernobyl, Fukushima) represent new targets of CIR research. We show that many microorganisms can grow under intense gamma-CIR dose rates of 13-126 Gy/h, with fungi identified as a particularly CIR-resistant group of eukaryotes: among 145 phylogenetically diverse strains tested, 78 grew under 36 Gy/h. Importantly, we demonstrate that CIR resistance can depend on cell concentration and that certain resistant microbial cells protect their neighbors (not only conspecifics, but even radiosensitive species from a different phylum), from high-level CIR. We apply a mechanistically-motivated mathematical model of CIR effects, based on accumulation/removal kinetics of reactive oxygen species (ROS) and antioxidants, in bacteria (3 Escherichia coli strains and Deinococcus radiodurans) and in fungi (Candida parapsilosis, Kazachstania exigua, Pichia kudriavzevii, Rhodotorula lysinophila, Saccharomyces cerevisiae, and Trichosporon mucoides). We also show that correlations between responses to CIR and acute ionizing radiation (AIR) among studied microorganisms are weak. For example, in D. radiodurans, the best molecular correlate for CIR resistance is the antioxidant enzyme catalase, which is dispensable for AIR resistance; and numerous CIR-resistant fungi are not AIR-resistant. Our experimental findings and quantitative modeling thus demonstrate the importance of investigating CIR responses directly, rather than extrapolating from AIR. Protection of radiosensitive cell-types by radioresistant ones under high-level CIR is a potentially important new tool for bioremediation of radioactive sites and development of CIR-resistant microbiota as radioprotectors.


Conflict of interest statement

Competing Interests: The authors have declared that no competing interests exist.

Figures

Fig 1
Fig 1. Aerobic growth of microorganisms under CIR.
a: Bacteria. b: Clonogenic survival of bacteria under CIR. For the corresponding CIR study under microaerobic conditions, see S1 Fig. In this and the following figure, dilutions shown in panels a and c are on a log10 scale and represent order of magnitude changes in initial cell concentration. The bars shown in panel b are based on CFU counts normalized to 1 ml: the actual numbers of viable cells are 200 times smaller because only 5 μl of each species were used in these experiments. At 94 Gy/h, individual colonies could not always be reliably identified, and therefore the bars at this dose rate represent estimates. Abbreviations: No IR = no irradiation; sealed = microaerobic. Red arrows indicate cases where 10-fold reduction in cell concentration completely extinguished growth at a given dose rate. c: Fungi.
Fig 2
Fig 2. Effect of catalase on CIR resistance.
a: Growth of DR and DRkat- under 36 Gy/h, or without CIR. Dilutions of DR and DRkat- are indicated. b: Growth restoration of DRkat- under 36 Gy/h by catalase, added to the central area of a TGY plate that was pre-inoculated with DRkat- cells. Dilutions (log10 based) of inoculated DRkat- are indicated.
Fig 3
Fig 3. Comparison of observed and model-predicted growth-inhibitory critical CIR dose rates for microorganisms grown under aerobic conditions.
a: Bacteria. b: Fungi. Green diamonds: highest tested dose rate at which any growth was observed. Red squares: lowest tested dose rate at which no growth was observed. Blue curves: best-fit model predictions. Black points: uncertainty range of model predictions. Model-based predictions at cell concentrations higher than those tested had very large uncertainties for EC2 and SC and, therefore, the prediction curves were truncated at cell concentrations slightly above 0 dilution for these organisms.
Fig 4
Fig 4. ORAC of TGY harvested with or without bacterial growth.
a: The net AUC (net area under the fluorescence decay curve) is an integrative value of total fluorescence during antioxidant reaction in the presence of the indicated sample. b: Linear regression for log-transformed ratios of net AUC for samples with indicated bacteria to samples without bacteria, vs. log-transformed time. Red lines = regression best fits, blue lines = 95% confidence intervals. Y-axis values >0 suggest that the indicated microorganisms increased the ORAC of the medium; values <0 suggest the opposite—microorganisms decreased the ORAC.
Fig 5
Fig 5. Microbial cooperation under CIR.
a: Growth of EC1 in the presence or absence of 36 Gy/h for 2 days, either in pure culture or mixed in 1:1 co-culture with DR. b: As for panel A, but with DRkat- substituting for DR. The y-axis shows clonogenically viable cell concentrations normalized to 1 ml: the actual numbers of viable cells are 200 times smaller because only 5 μl of each species were used in these experiments. Dashed lines indicate cell concentrations under the assumption of no net proliferation.
Fig 6
Fig 6. Quantification of responses to AIR and CIR for fungi.
Logistic regression intended to predict growth at 36 Gy/h based on log10[D10]. D10 = AIR dose which kills 90% of population. Growth at 36 Gy/h was a binary variable (0 = no growth, 1 = growth). Blue circles indicate raw data; Black squares indicate summary data for log10[D10] quartiles, where x-axis shows median log10[D10] values for each quartile and y-axis shows fractions of fungi which grew under 36 Gy/h; Red curve = best-fit model predictions.
Fig 7
Fig 7. A schematic representation of the effects of cell concentration on microbial resistance to CIR.

References

    1. Fredrickson JK, Zachara JM, Balkwill DL, Kennedy D, Li SW, Kostandarithes HM, et al. Geomicrobiology of high-level nuclear waste-contaminated vadose sediments at the hanford site, washington state. Appl Environ Microbiol. 2004;70: 4230–41. doi: 10.1128/AEM.70.7.4230-4241.2004 - DOI - PMC - PubMed
    1. Perdrial N, Thompson A, LaSharr K, Amistadi MK, Chorover J. Quantifying Particulate and Colloidal Release of Radionuclides in Waste-Weathered Hanford Sediments. J Environ Qual. 2015;44: 945 doi: 10.2134/jeq2014.09.0388 - DOI - PubMed
    1. Kim M-HY, Rusek A, Cucinotta FA. Issues for Simulation of Galactic Cosmic Ray Exposures for Radiobiological Research at Ground-Based Accelerators. Front Oncol. 2015;5: 122 doi: 10.3389/fonc.2015.00122 - DOI - PMC - PubMed
    1. Cucinotta FA, Cacao E. Non-Targeted Effects Models Predict Significantly Higher Mars Mission Cancer Risk than Targeted Effects Models. Sci Rep. 2017;7: 1832 doi: 10.1038/s41598-017-02087-3 - DOI - PMC - PubMed
    1. Daly MJ, Gaidamakova EK, Matrosova VY, Vasilenko A, Zhai M, Venkateswaran A, et al. Accumulation of Mn(II) in Deinococcus radiodurans facilitates gamma-radiation resistance. Science. 2004;306: 1025–8. doi: 10.1126/science.1103185 - DOI - PubMed

MeSH terms

LinkOut - more resources