. 2017 Dec 19;21(12):3471-3482.
doi: 10.1016/j.celrep.2017.11.087.

Transcriptional Changes during Naturally Acquired Zika Virus Infection Render Dendritic Cells Highly Conducive to Viral Replication

Affiliations

Transcriptional Changes during Naturally Acquired Zika Virus Infection Render Dendritic Cells Highly Conducive to Viral Replication

Xiaoming Sun et al. Cell Rep. .

Abstract

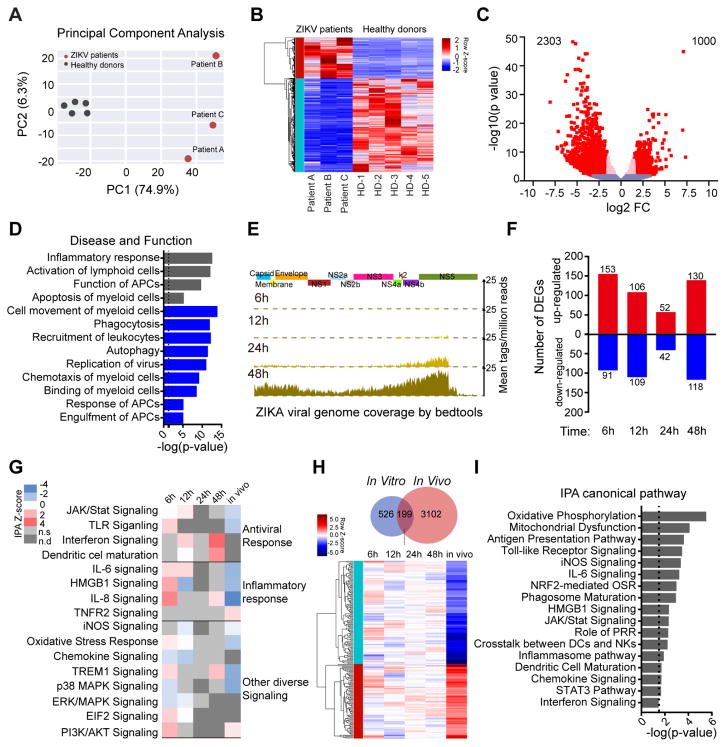
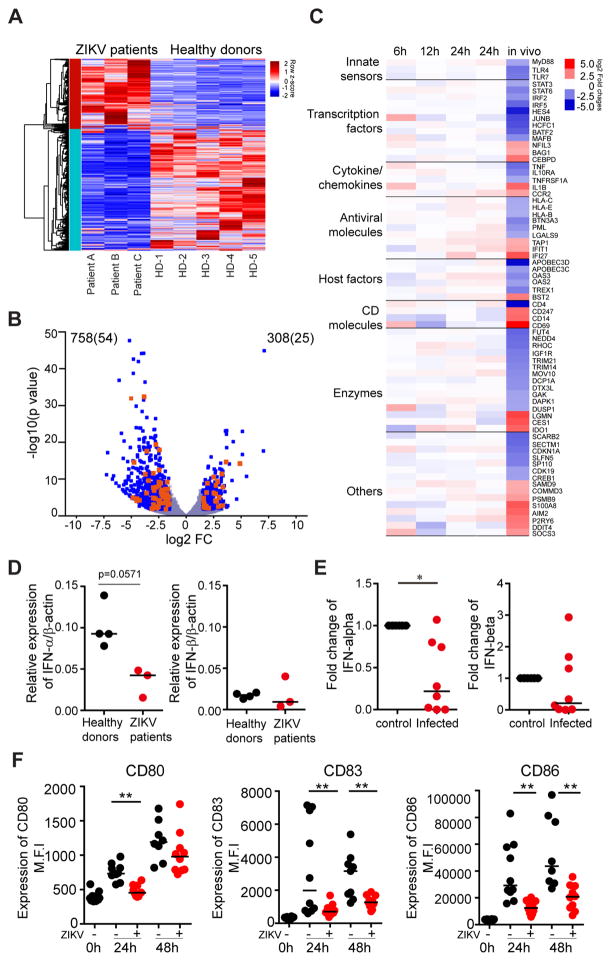
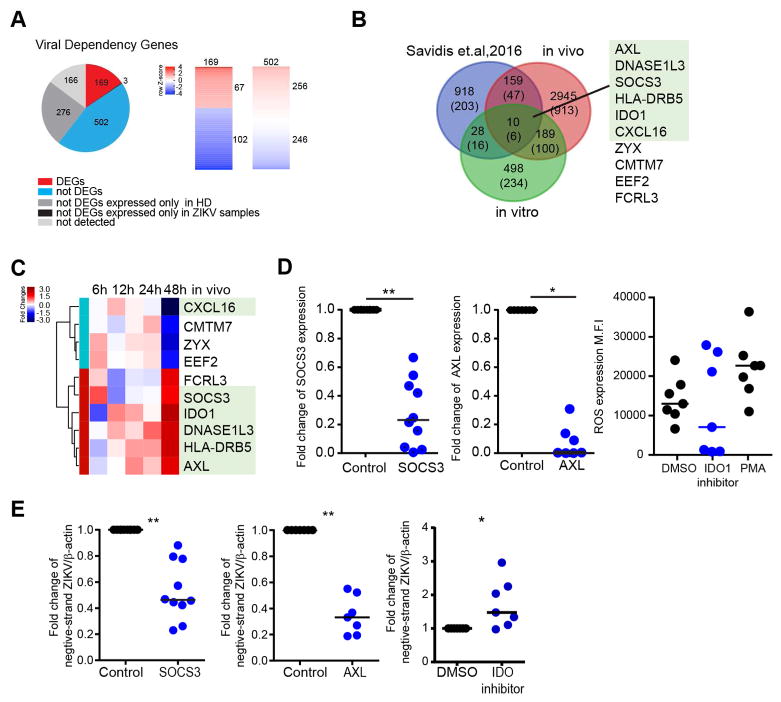
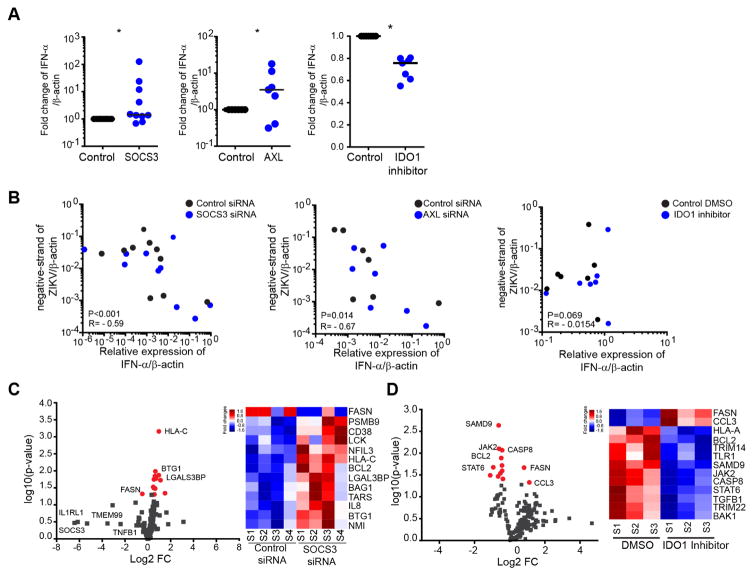
Although dendritic cells are among the human cell population best equipped for cell-intrinsic antiviral immune defense, they seem highly susceptible to infection with the Zika virus (ZIKV). Using highly purified myeloid dendritic cells isolated from individuals with naturally acquired acute infection, we here show that ZIKV induces profound perturbations of transcriptional signatures relative to healthy donors. Interestingly, we noted a remarkable downregulation of antiviral interferon-stimulated genes and innate immune sensors, suggesting that ZIKV can actively suppress interferon-dependent immune responses. In contrast, several host factors known to support ZIKV infection were strongly upregulated during natural ZIKV infection; these transcripts included AXL, the main entry receptor for ZIKV; SOCS3, a negative regulator of ISG expression; and IDO-1, a recognized inducer of regulatory T cell responses. Thus, during in vivo infection, ZIKV can transform the transcriptome of dendritic cells in favor of the virus to render these cells highly conducive to ZIKV infection.

Keywords: AXL; IDO-1; RNA-seq; SOCS3; Zika virus; acute infection; dendritic cells; flavivirus; interferon stimulated genes.


Conflict of interest statement

Competing Interests

The authors declare that no competing interest exists.

Figures

Figure 1
Figure 1. Zika virus replication in in vitro infected cell subsets from adult PBMCs and cord blood
(A) PBMCs and CBMCs were infected with ZIKV at MOI of 1 and viral replication was measured by qRT-PCR at indicated hours post-infection. Positive-strand viral RNA expression is shown after normalization to beta-actin (n = 10). (B) Comparison between ZIKV replication in in vivo infected PBMCs (blue) and CBMCs (red). Data show Mean±SD from 10 donors (n=10). (C) ZIKV replication in sorted cell populations from PBMCs and CBMCs after infection for 24hours with ZIKV at MOI of 1(n = 9). (D) Comparison between ZIKV replication in B cells (orange), NK cells (pink) and mDCs (purple) from PBMCs and CBMCs (n=9). (E) Analysis of ZIKV replication in pDCs and mDCs at indicated time points. (F) Analysis of negative-strand ZIKV RNA in pDCs and mDCs from PBMCs and CBMCs, as determined by qPCR at 24hours p.i. Horizontal lines reflect the median. * p<0.05; ** p<0.01; *** p < 0.001; **** p< 0.0001
Figure 2
Figure 2. Profound changes in the global transcriptional landscape of mDCs infected with ZIKV in vivo
(A) Principal component analysis (PCA) of RNA-seq data from mDCs isolated from three patients with acute ZIKV infection (red dots) and 5 healthy donors in mDCs (grey dots). The expression values are normalized across the entire data set. (B) Hierarchical clustering and heatmap of genes that are differentially expressed (DEGs) between ZIKV-infected patients and healthy donors. Displayed DEG had log2 FC≥1.5 fold changes in gene expression intensity and FDR-adjusted p-value <0.05, relative to the control cohort. (C) Volcano plot displaying genes detected by RNA-Seq. Pink dots represent genes which show FDR-adjusted p<0.05; red dots indicate genes with FDR-adjusted p<0.05 and log2FC>1.5. (D) Functional annotations of differentially-expressed genes, as determined using Ingenuity pathway analysis. Negative z-scores indicate decreased functional activity (blue), grey bars reflect z-scores with unknown functional activity changes. (E) Zika viral genome coverage detected by RNA-seq in in vitro infected mDCs at indicated hours post-infection. Alignment was performed using Bedtools software. (F) Waterfall plot representing the total number of up-regulated and down-regulated genes between in vitro infected mDCs and their respective controls at indicated time points. Transcripts with a nominal p-value <0.05 were considered as DEGs. (G) Predicted functional pathways of indicated DEG, as analyzed by Ingenuity Pathway analysis. z-scores >2 indicate functional pathway activation (red), whereas negative z-scores indicated pathway de-activation (blue). n.s.: not significant n.d: not detected. (H) Venn diagram indicates shared DEGs between in vivo and in vitro infected mDC samples, heatmap represents expression pattern of 199 genes that were differentially-expressed both in in vivo and in vitro infected mDCs. (I) Predicted functional pathways of shared 199 DEGs analyzed by Ingenuity Pathway analysis. Directional changes in gene expression intensity were not determined in this analysis.
Figure 3
Figure 3. Zika virus infection leads to downregulation of Interferon stimulated genes (ISGs) and impaired dendritic cells function
(A) Heatmap representing interferon stimulated genes (ISGs) that were differentially-expressed between mDCs isolated from ZIKV-infected patients and healthy controls. (B) Volcano plot reflecting all differentially-expressed ISG (FDR-adjusted p<0.05 and log2FC>1.5, blue dots). Differentially-expressed ISG with known antiviral function are highlighted in orange. (C) Heatmap reflecting expression intensity of a known list of antiviral ISG during in vivo and in vitro infection of mDCs with ZIKV. (D–E) Changes in mRNA expression of IFN-α or IFN-β from (D) in vivo infected compared to healthy donors and (E) from in vitro infected normalized to uninfected cells. (F) Surface expression of indicated dendritic cell immune activation (CD83) and maturation markers (CD80 and CD86) at 0h, 24h and 48h post infection (+). Data from uninfected controls (−) are shown for comparison. Horizontal lines reflect the median. * p<0.05; ** p<0.01; *** p < 0.001; **** p< 0.0001
Figure 4
Figure 4. Upregulation of viral dependency genes during natural ZIKV infection
(A) Pie chart of the viral dependency genes reported by Savidis et al. (Savidis et al., 2016a). Colors indicate expression intensity of these genes in mDCs from ZIKV-infected patients or healthy donors (left panel). Heatmaps reflect the relative ratio of gene expression intensity between ZIKV-infected patients and controls for 169 viral dependency genes meeting criteria for DEG, and for 502 dependency genes that were expressed in mDCs from ZIKV patients and controls but did not meet criteria for DEGs (right panel). (B) Venn diagram reflecting overlay between DEGs in in vivo and in vitro infected mDCs, and Zika virus dependency genes reported by Savidis et al. (Savidis et al., 2016a). Numbers of ISGs are listed in parentheses. Gene identities of the 10 transcripts detected in all three gene sets are listed, the green box highlights ISGs. (C) Heatmap representing gene expression changes of the n=10 viral dependency genes with differential gene expression in both in vitro and in vivo infected mDCs described in (B). Color code reflects the fold-changes in ZIKV-infected samples relative to corresponding controls. (D) Fold changes of SOCS3 and AXL expression following siRNA-mediated gene silencing relative to control samples (left and middle panels) and intensity of reactive oxidative species (ROS) production following inhibition of IDO-1 activity (right panel). (E) Monocyte-derived dendritic cells were pretreated with SOCS3 siRNA or AXL siRNA for 48hours, or pretreated with 100μM of the IDO1 inhibitor (NLG919) for 2h. Cells were then infected with Zika virus at MOI of 1. Negative-strand Zika RNA was measured after 24 hours p.i. and normalized to untreated controls. Horizontal lines reflect the median. * p<0.05; ** p<0.01; *** p < 0.001; **** p< 0.0001.
Figure 5
Figure 5. AXL, SOCS3 and IDO-1 alter type I interferon responses during ZIKV infection
(A) Expression of IFN-α after 24 hours post-infection with ZIKV in MDDCs manipulated as described in Figure 4E. Fold-changes normalized to untreated controls are shown. (B) Correlations between the expression levels of IFN-α and the corresponding ZIKV negative strand RNA levels after silencing SOCS3 (left, n=10), silencing AXL (middle, n=7) or addition of the IDO1 inhibitor NLG99 (right, n=7). Cumulative data were analyzed using generalized estimated equations adjusted for repeated measures. (C) and (D) Volcano plots reflecting changes in expression of host genes involved in flavivirus pathogenesis following downregulation of SOCS3 (C) or inhibition of IDO1 (D). Differentially-expressed genes (nominal p<0.05) are indicated in red. Heatmaps reflect gene expression changes of the differentially-expressed genes; color coding indicates gene expression intensity. Horizontal lines reflect the median. * p<0.05; ** p<0.01; *** p < 0.001; **** p< 0.0001.

References

    1. Bailey CC, Zhong G, Huang I-C, Farzan M. IFITM-Family Proteins: The Cell’s First Line of Antiviral Defense. Annu Rev Virol. 2014;1:261–283. - PMC - PubMed
    1. Bayer A, Lennemann NJ, Ouyang Y, Bramley JC, Morosky S, Marques ETDA, Cherry S, Sadovsky Y, Coyne CB. Type III Interferons Produced by Human Placental Trophoblasts Confer Protection against Zika Virus Infection. Cell Host Microbe. 2016;19:705–712. - PMC - PubMed
    1. Bhattacharyya S, Zagórska A, Lew ED, Shrestha B, Rothlin CV, Naughton J, Diamond MS, Lemke G, Young JAT. Enveloped viruses disable innate immune responses in dendritic cells by direct activation of TAM receptors. Cell Host Microbe. 2013;14:136–147. - PMC - PubMed
    1. Bowen JR, Quicke KM, Maddur MS, O’Neal JT, McDonald CE, Fedorova NB, Puri V, Shabman RS, Pulendran B, Suthar MS. Zika Virus Antagonizes Type I Interferon Responses during Infection of Human Dendritic Cells. PLoS Pathog. 2017;13:e1006164. - PMC - PubMed
    1. Boyer Chammard T, Schepers K, Breurec S, Messiaen T, Destrem A-L, Mahevas M, Soulillou A, Janaud L, Curlier E, Herrmann-Storck C, et al. Severe Thrombocytopenia after Zika Virus Infection, Guadeloupe, 2016. Emerg Infect Dis. 2017;23:696–698. - PMC - PubMed

MeSH terms

Substances