. 2017 Dec 19;21(12):3548-3558.
doi: 10.1016/j.celrep.2017.11.081.

Systemic Messenger RNA Therapy as a Treatment for Methylmalonic Acidemia

Affiliations

Systemic Messenger RNA Therapy as a Treatment for Methylmalonic Acidemia

Ding An et al. Cell Rep. .

Erratum in

  • Systemic Messenger RNA Therapy as a Treatment for Methylmalonic Acidemia.
    An D, Schneller JL, Frassetto A, Liang S, Zhu X, Park JS, Theisen M, Hong SJ, Zhou J, Rajendran R, Levy B, Howell R, Besin G, Presnyak V, Sabnis S, Murphy-Benenato KE, Kumarasinghe ES, Salerno T, Mihai C, Lukacs CM, Chandler RJ, Guey LT, Venditti CP, Martini PGV. An D, et al. Cell Rep. 2018 Aug 28;24(9):2520. doi: 10.1016/j.celrep.2018.08.049. Cell Rep. 2018. PMID: 30157442 No abstract available.

Abstract

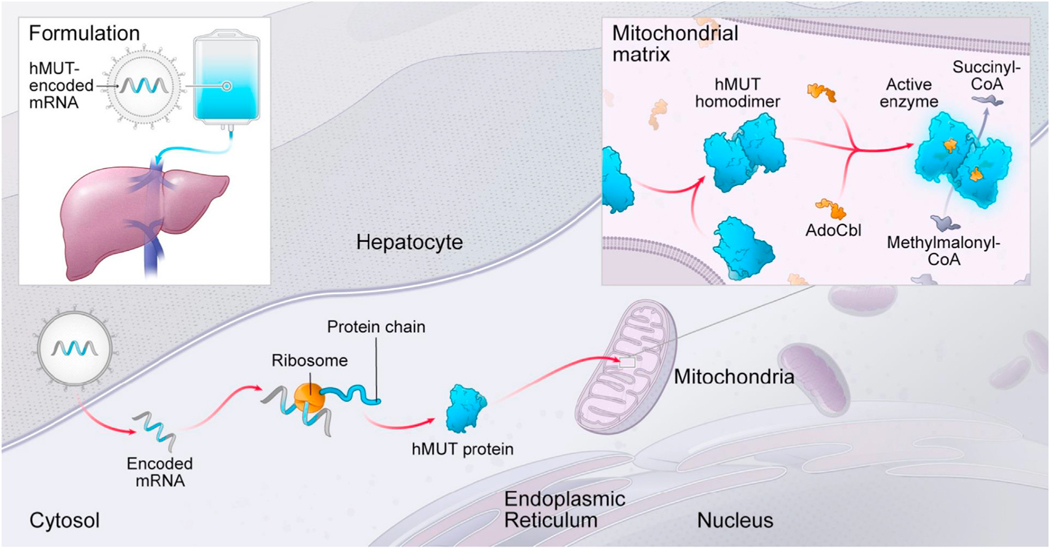
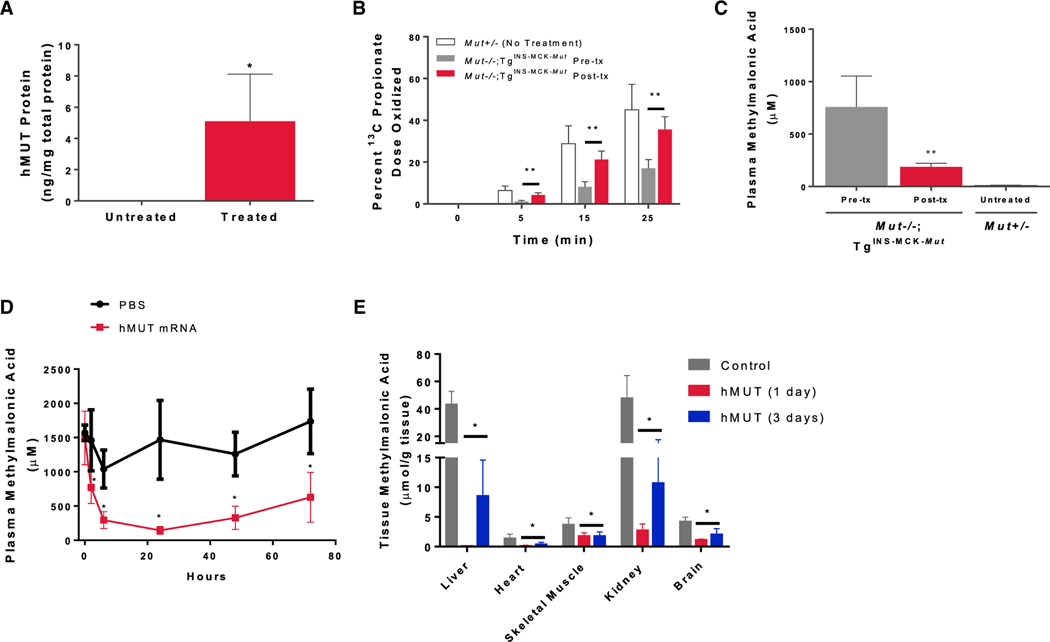
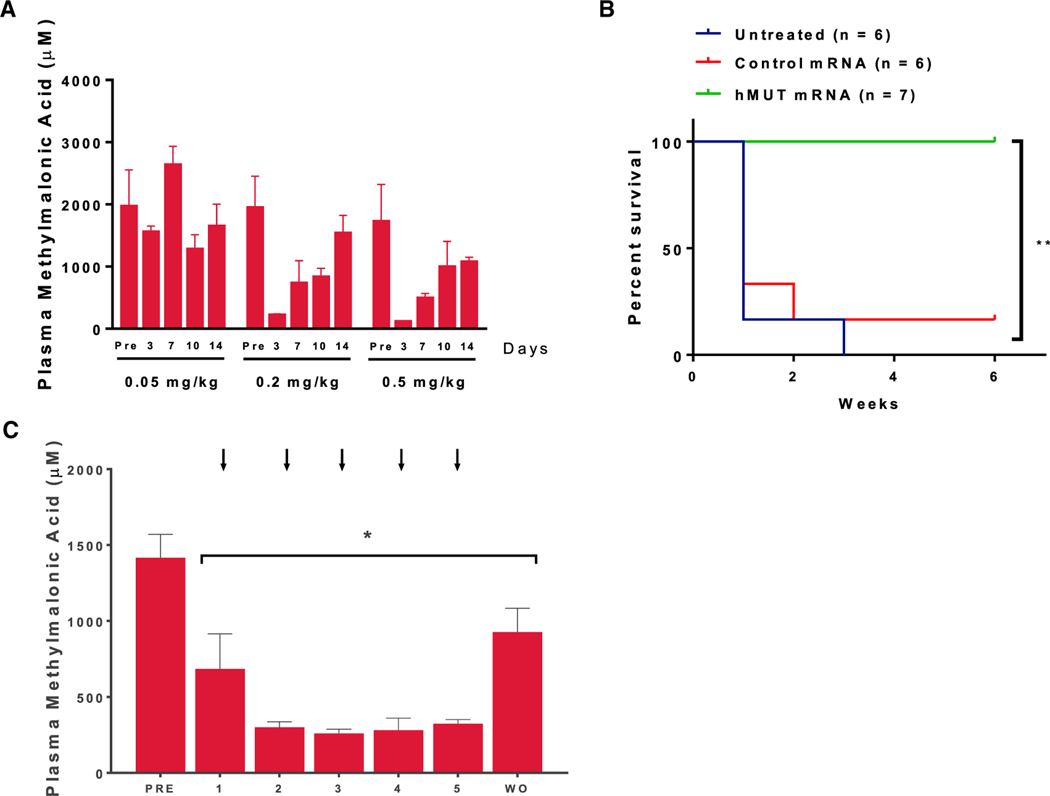
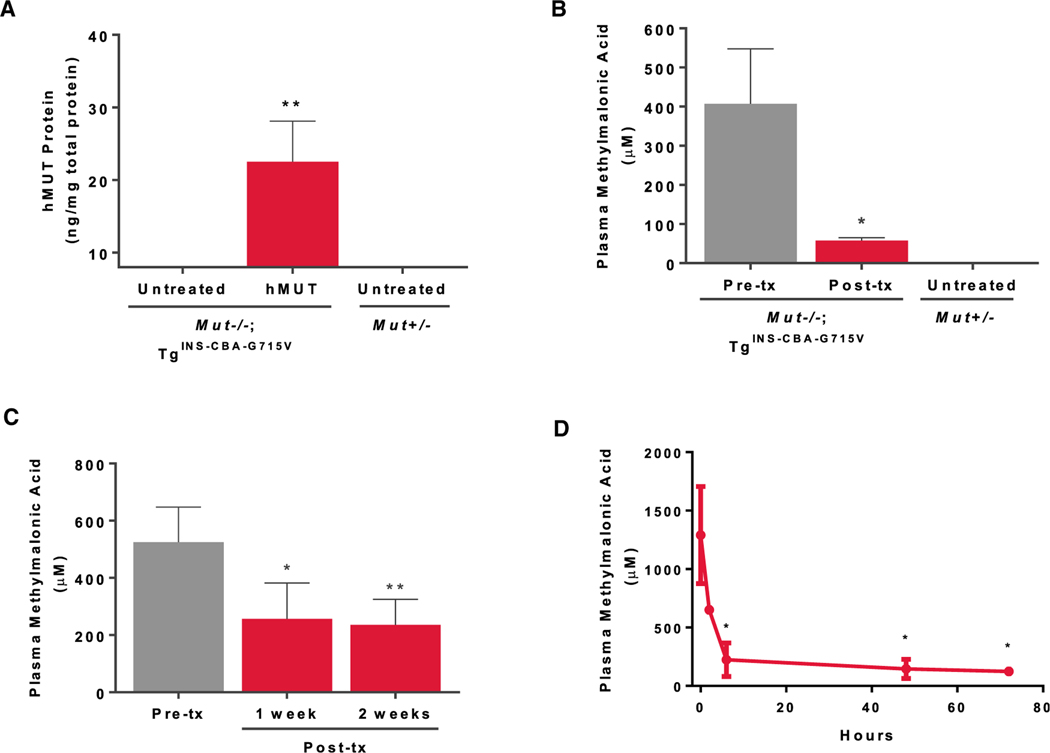
Isolated methylmalonic acidemia/aciduria (MMA) is a devastating metabolic disorder with poor outcomes despite current medical treatments. Like other mitochondrial enzymopathies, enzyme replacement therapy (ERT) is not available, and although promising, AAV gene therapy can be limited by pre-existing immunity and has been associated with genotoxicity in mice. To develop a new class of therapy for MMA, we generated a pseudoU-modified codon-optimized mRNA encoding human methylmalonyl-CoA mutase (hMUT), the enzyme most frequently mutated in MMA, and encapsulated it into biodegradable lipid nanoparticles (LNPs). Intravenous (i.v.) administration of hMUT mRNA in two different mouse models of MMA resulted in a 75%-85% reduction in plasma methylmalonic acid and was associated with increased hMUT protein expression and activity in liver. Repeat dosing of hMUT mRNA reduced circulating metabolites and dramatically improved survival and weight gain. Additionally, repeat i.v. dosing did not increase markers of liver toxicity or inflammation in heterozygote MMA mice.

Keywords: lipid nanoparticle; liver; mRNA therapy; methylmalonic acid; methylmalonic acidemia/aciduria; methylmalonyl-CoA mutase.


Conflict of interest statement

DECLARATION OF INTERESTS

D.A., A.F., S.L., X.Z., J.P., M.T., S.H., J.Z., R.R., B.L., R.H., G.B., V.P., S.S., K.E.M., E.S.K., T.S., C.M., C.L., L.T.G., and P.G.V.M. are employees of, and receive salary and stock options from, Moderna Therapeutics. J.L.S., R.J.C., and C.P.V. declare no competing interests.

Figures

Figure 1.
Figure 1.. Strategy of hMUT mRNA Therapy
Chemically modified and codon-optimized hMUT mRNA encapsulated in LNP is administrated using an i.v. injection. The LNP delivers the mRNA into hepatocytes where it is translated, undergoes mitochondrial importation and processing, and then forms a homodimer. The MUT enzyme requires the cofactor adenosylcobalamin (AdoCbl) for activity to catalyze the isomerization of L-methylmalonyl-CoA into succinyl-CoA.
Figure 2.
Figure 2.. Expression, Activity, and Localization of mRNA-Encoded MUT
Human fibroblasts (1 × 10⁶) isolated from a healthy subject (control) and 2 mut0 patients were transfected with 1 μg eGFP or hMUT mRNA for 24 hr. (A) hMUT expression in transfected human fibroblasts was determined by western blotting. Expression levels were quantified and normalized to α-tubulin levels. (B) MUT activity in transfected human fibroblasts. (C) Transfected cells were incubated with MitoTracker Red for 30 min to mark mitochondria and then stained with an anti-MUT mouse monoclonal antibody (mAb) to examine cellular localization (scale bars, 10 μm). Data are presented as mean ± SD. *p < 0.05 compared to corresponding control group of same treatment, #p < 0.05 compared to its own eGFP group. p values obtained from pairwise Tukey’s post hoc test after two-way ANOVA. n = 3 independent experiments.
Figure 3.
Figure 3.. Pharmacokinetics of LNP and hMUT mRNA and Protein
Wild-type mice (CD-1) were administered a single i.v. bolus of 0.5 mg/kg hMUT mRNA encapsulated in a biodegradable LNP and sacrificed at various time points (2, 6, 16 hr, 1, 2, 3, 5, 7 days; n = 3 mice/time point). (A) Ionizable lipid in liver extracts was quantified by LC-MS/MS. (B) Hepatic hMUT mRNA following hMUT administration was quantified using a branched-chain DNA (bDNA) assay. (C) hMUT mRNA distribution was determined by in situ hybridization (ISH) using an hMUT mRNA-specific probe. (D) Hepatic hMUT protein levels following hMUT mRNA administration. hMUT protein was quantified by LC-MS/MS. ****p < 0.0001, p values obtained from Tukey’s multiple-comparison test after one-way ANOVA.
Figure 4.
Figure 4.. Single i.v. Dose of hMUT mRNA Increased Hepatic MUT Expression, Enhanced Propionate Oxidation, and Lowered Plasma and Tissue Methylmalonic Acid in Mut−/−;TgINS-MCK-Mut Mice
Mut−/−;TgINS-MCK-Mut mice (n = 4) were administered a single i.v. dose (0.5 mg/kg) of hMUT mRNA encapsulated in LNP and sacrificed 3 days later. (A) Hepatic MUT expression in Mut−/−;TgINS-MCK-Mut mice was quantified using LC-MS/MS. (B) Propionate oxidation in Mut−/−;TgINS-MCK-Mut mice before and 3 days after hMUT mRNA treatment. The percentage of the administered 1-13C-propionate dose that was oxidized was determined by measuring 13C enrichment in expired CO2 at multiple time points. (C) Plasma methylmalonic acid concentrations in Mut−/−;TgINS-MCK-Mut mice 3 days after hMUT mRNA treatment analyzed by LC-MS/MS. (D) Plasma methylmalonic acid concentrations 1 day before, and 2, 6, 24, 48, and 72 hr after a single i.v. injection of hMUT mRNA (0.5 mg/kg) or PBS control in Mut−/−;TgINS-MCK-Mut mice (n = 4–8/group). (E) Tissue methylmalonic concentrations in liver, heart, skeletal muscle (SM), kidney, and brain in PBS-injected control and hMUT mRNA (0.5 mg/kg)-treated Mut−/−;TgINS-MCK-Mut mice (n = 4–8/group). hMUT mRNA-treated mice were sacrificed at 1 day or 3 days after a single i.v. injection. Data shown as mean ± SD. *p < 0.05, **p < 0.01. p values obtained from paired t tests to compare post-treatment versus pre-treatment values.
Figure 5.
Figure 5.. Repeat i.v. Administration of hMUT mRNA Improved Survival and Ameliorated Metabolic Alterations in mut0 MMA Mice
To explore the dosage and dosing frequency, Mut−/−;TgINS-MCK-Mut mice received a single i.v. injection of hMUT mRNA at 0.05–0.5 mg/kg (n = 6–7). Mice were bled 4 days before and 3, 7, 10, and 14 days after a single i.v. injection. (A) Plasma methylmalonic acid response and duration of effect across 3 doses (0.05, 0.2, 0.5 mg/kg). Mut−/−;TgINS-MCK-Mut mice received weekly i.v. injections of hMUT mRNA or a control mRNA for 5 doses at 0.2 mg/kg. (B) Survival curve of untreated, control mRNA and hMUT mRNA-treated Mut−/−;TgINS-MCK-Mut mice. **p < 0.01 from log-rank test. (C) Plasma methylmalonic acid concentrations 3 days after each dose in Mut−/−;TgINS-MCK-Mut mice. Plasma methylmalonic acid concentrations 6 days after each hMUT mRNA dose were similar to concentrations measured 3 days after each dose (data not presented). Arrows indicate the day of injection. WO = 10 day washout following the last i.v. injection. (A–C) Data shown as median ± MAD (A) and mean ± SD (B and C). *p < 0.05, p values obtained from Tukey’s multiple-comparison test after one-way ANOVA.
Figure 6.
Figure 6.. i.v. Administration of hMUT mRNA Improved Metabolism for More Than 1 Week in mut MMA Mice
(A) Mut−/−;TgINS-CBA-G715V (n = 4) were administered a single i.v. dose (0.2 mg/kg) of hMUT mRNA and sacrificed 3 days later. Hepatic hMUT expression measured by LC-MS/MS in Mut−/−;TgINS-CBA-G715V mice 3 days after a single i.v. hMUT mRNA injection. (B) Plasma methylmalonic acid concentrations in Mut−/−;TgINS-MCK-Mut mice 1 day before and 3 days after a single i.v. hMUT mRNA injection. (C) Plasma methylmalonic acid concentrations 1 day before, 1 week after, and 2 weeks after a single i.v. injection of hMUT mRNA (0.1 mg/kg) in Mut−/−;TgINS-CBA-G715V mice (n = 4). (D) Plasma methylmalonic acid concentrations 1 day before, 2, 6, 48, and 72 hr after a single i.v. injection of hMUT mRNA (0.2 mg/kg) in Mut−/−;TgINS-CBA-G715V mice (n = 7). (A–D) Data shown as mean ± SD (A–C) and median ± MAD (D). *p < 0.05, **p < 0.01. values obtained from paired t tests to compare post-treatment versus pre-treatment values.

References

    1. Akinc A, Zumbuehl A, Goldberg M, Leshchiner ES, Busini V, Hossain N, Bacallado SA, Nguyen DN, Fuller J, Alvarez R, et al. (2008). A combinatorial library of lipid-like materials for delivery of RNAi therapeutics. Nat. Biotechnol 26, 561–569. - PMC - PubMed
    1. American Academy of Pediatrics Newborn Screening Authoring Committee (2008). Newborn screening expands: recommendations for pediatricians and medical homes–implications for the system. Pediatrics 121, 192–217. - PubMed
    1. Baba M, Itaka K, Kondo K, Yamasoba T, and Kataoka K. (2015). Treatment of neurological disorders by introducing mRNA in vivo using polyplex nanomicelles. J. Control. Release 201, 41–48. - PubMed
    1. Barros SA, and Gollob JA (2012). Safety profile of RNAi nanomedicines. Adv. Drug Deliv. Rev 64, 1730–1737. - PubMed
    1. Baumgartner MR, Hörster F, Dionisi-Vici C, Haliloglu G, Karall D, Chapman KA, Huemer M, Hochuli M, Assoun M, Ballhausen D, et al. (2014). Proposed guidelines for the diagnosis and management of methylmalonic and propionic acidemia. Orphanet J. Rare Dis 9, 130. - PMC - PubMed

Supplementary concepts