. 2017 Oct 25;8(61):102898-102911.
doi: 10.18632/oncotarget.22048. eCollection 2017 Nov 28.

Unique signalling connectivity of FGFR3-TACC3 oncoprotein revealed by quantitative phosphoproteomics and differential network analysis

Affiliations

Unique signalling connectivity of FGFR3-TACC3 oncoprotein revealed by quantitative phosphoproteomics and differential network analysis

Benedetta Lombardi et al. Oncotarget. .

Abstract

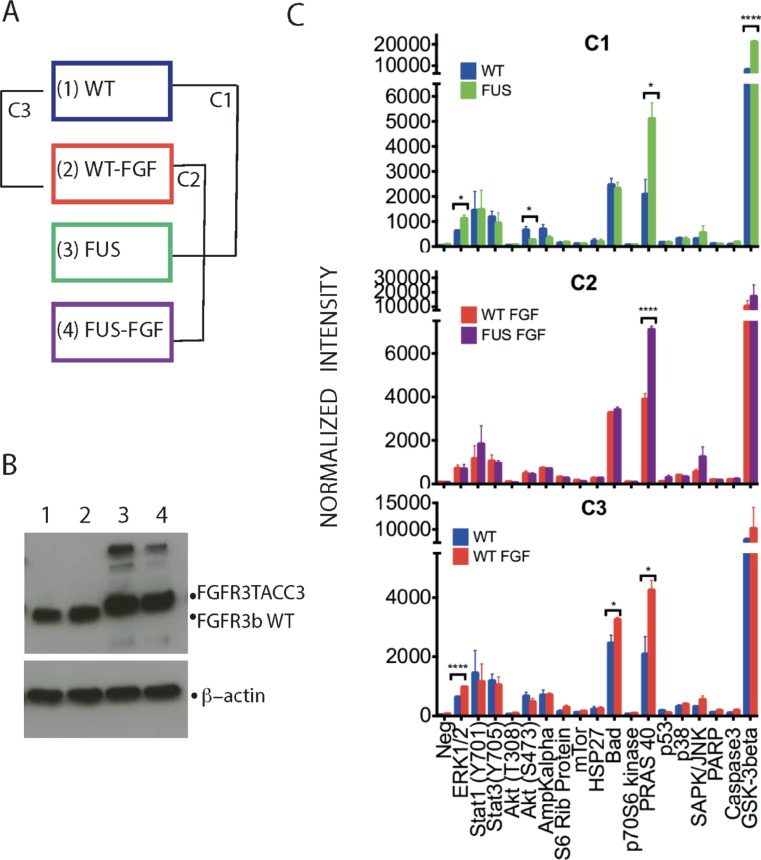
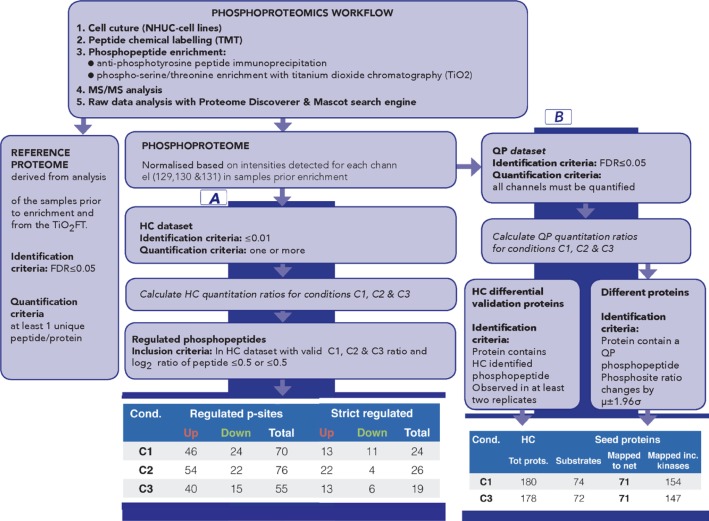
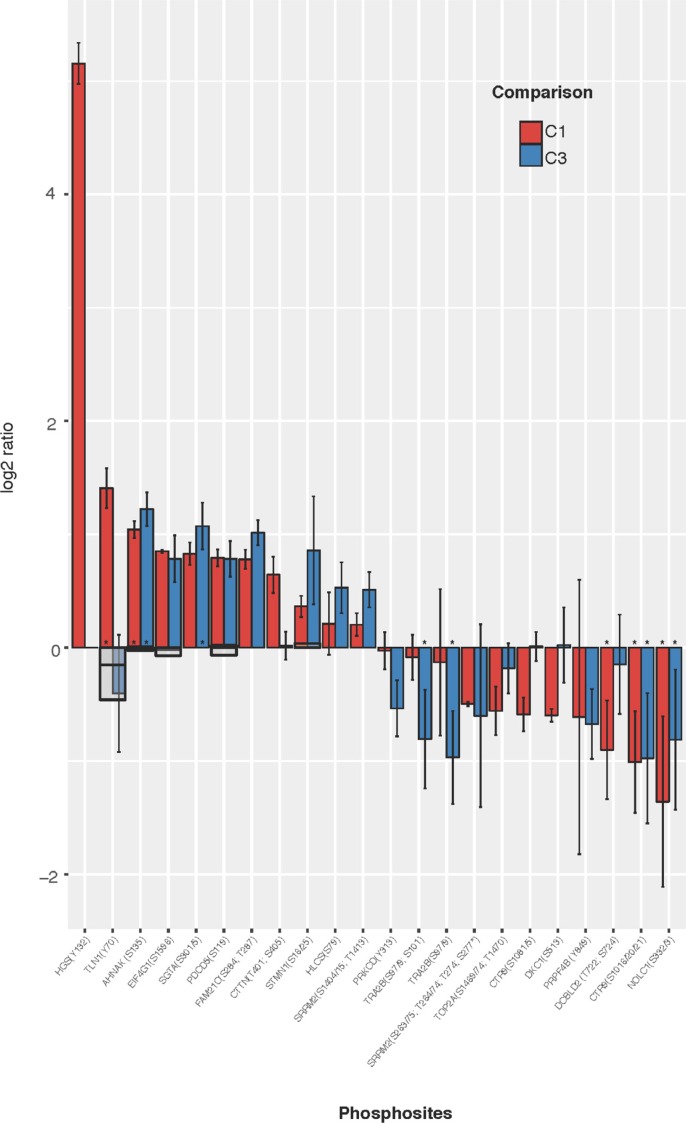
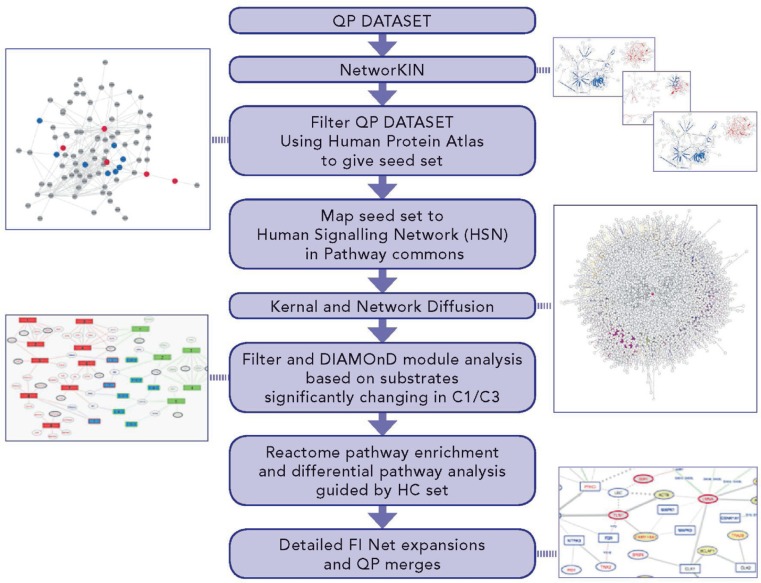
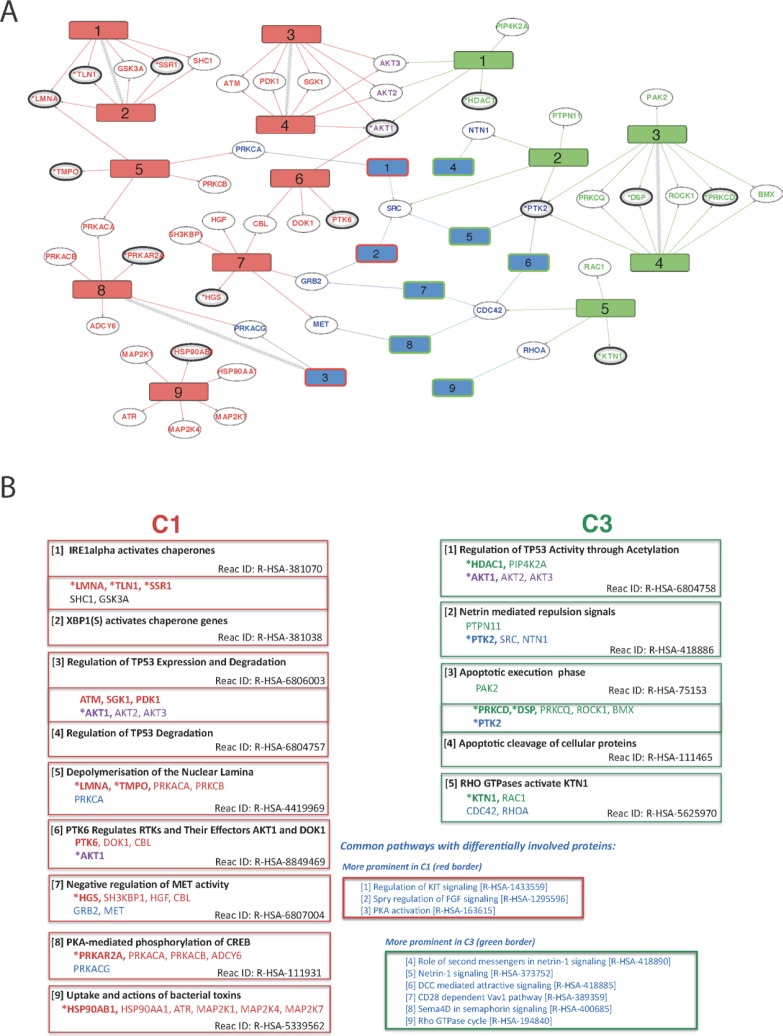
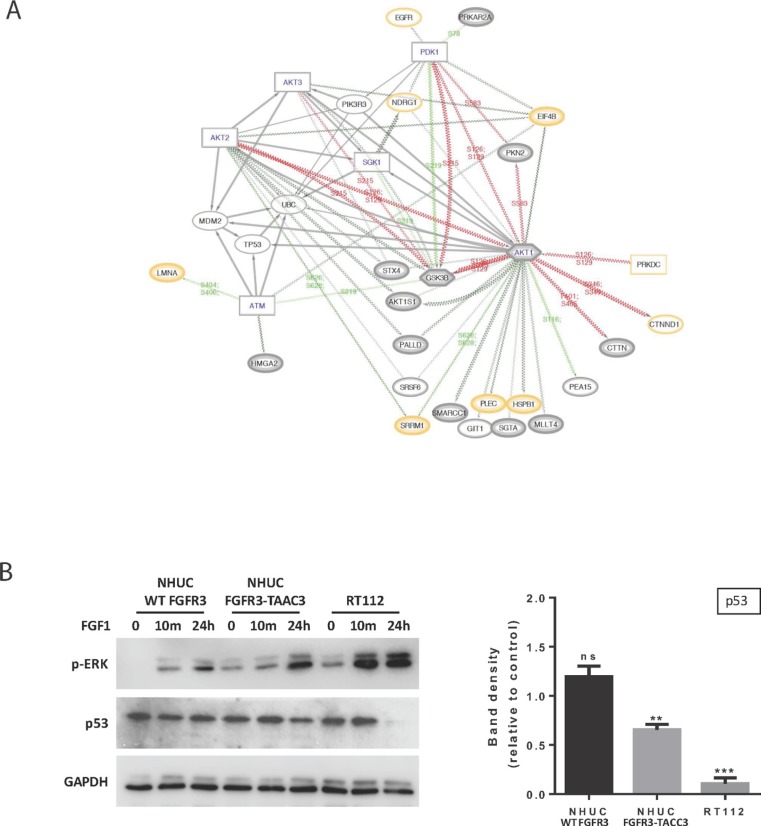
The FGFR3-TACC3 fusion is an oncogenic driver in diverse malignancies, including bladder cancer, characterized by upregulated tyrosine kinase activity. To gain insights into distinct properties of FGFR3-TACC3 down-stream signalling, we utilised telomerase-immortalised normal human urothelial cell lines expressing either the fusion or wild-type FGFR3 (isoform IIIb) for subsequent quantitative proteomics and network analysis. Cellular lysates were chemically labelled with isobaric tandem mass tag reagents and, after phosphopeptide enrichment, liquid chromatography-high mass accuracy tandem mass spectrometry (LC-MS/MS) was used for peptide identification and quantification. Comparison of data from the two cell lines under non-stimulated and FGF1 stimulated conditions and of data representing physiological stimulation of FGFR3 identified about 200 regulated phosphosites. The identified phosphoproteins and quantified phosphosites were further analysed in the context of functional biological networks by inferring kinase-substrate interactions, mapping these to a comprehensive human signalling interaction network, filtering based on tissue-expression profiles and applying disease module detection and pathway enrichment methods. Analysis of our phosphoproteomics data using these bioinformatics methods combined into a new protocol-Disease Relevant Analysis of Genes On Networks (DRAGON)-allowed us to tease apart pathways differentially involved in FGFR3-TACC3 signalling in comparison to wild-type FGFR3 and to investigate their local phospho-signalling context. We highlight 9 pathways significantly regulated only in the cell line expressing FGFR3-TACC3 fusion and 5 pathways regulated only by stimulation of the wild-type FGFR3. Pathways differentially linked to FGFR3-TACC3 fusion include those related to chaperone activation and stress response and to regulation of TP53 expression and degradation that could contribute to development and maintenance of the cancer phenotype.

Keywords: FGFR-TACC-fusion; cancer; network analysis; quantitative phosphoproteomics; signaling pathways.


Conflict of interest statement

CONFLICTS OF INTEREST There is no conflict of interest to disclose.

Figures

Figure 1
Figure 1. Phosphorylation profiles of selected intracellular signalling proteins allows initial comparison of WT and FUS and their responses to FGF stimulation
(A) Two TERT-NHUC cells lines, stably expressing either the WT FGFR3 (IIIb) or FGFR3-TACC3 fusion, were analysed without or following stimulation by 100 ng/ml FGFR1 for 10 min (in both cases 100 IU/ml heparin was included in incubation medium for 10 min). The four resulting experimental conditions have been designated as WT (1), WT-FGF (2), FUS (3) and FUS-FGF (4). Further comparisons of data generated from these conditions were between WT and FUS (comparison 1; C1), WT-FGF and FUS-FGF (comparison 2; C2) and WT and WT-FGF (comparison 3; C3). (B) Western blotting with anti-FGFR3 antibody to detect WT FGFR3 or FGFR3-TACC3 fusion in cell lysates from four experimental conditions described in (A): WT (1), WT-FGF (2), FUS (3) and FUS-FGF (4) (top panel). β-actin was used as a loading control (bottom panel). (C) Antibody array analysis comprising indicated proteins and their phospho-sites performed using cell lysates from four conditions, defined and compared as outlined in (A). Comparisons cover WT and FUS (C1) (top panel), WT-FGF and FUS-FGF (C2) (middle panel) and WT and WT-FGF (C3) (bottom panel). Data are shown as average signals from two independent experiments on two different biological replicates (number of stars: significantly changing phosphosites, unpaired Student’s t-test, p ≤ 0.05. Error bars: S.E.M.). See Supplementary Figure 1 for further information about the antibody array and analyses.
Figure 2
Figure 2. Overview of phosphoproteomics workflow for data generation and analysis
The workflow provides both phospho and reference proteome datasets. Part A of the data analysis workflow, based on High Confidence (HC) quantitative proteomics dataset, has been designed to identify the most significantly regulated phosphosites between C1, C2 and C3. Number of regulated and sites for each comparison is summarised (part A, last panel); strict regulated sites additionally require >1 replicate and that μ±1.96σ does not include 1. Part B of the data analysis workflow has been designed to generate seeds for subsequent network analysis; it is based on Quantitative Proteomics (QP) dataset [QP requires all channels to be quantified but with a less stringent FDR (5%)] to allow a broad pool of initial seeds while HC dataset is used to filter pathway results. Number of proteins for C1 and C3 is shown (part B, last panel). See also Supplementary Tables 1– 6 and Supplementary Figure 2 (for replicate correlations) and Supplementary Figure 4 (for comparison of HC and QP datasets).
Figure 3
Figure 3. Most significantly regulated phosphosites identified from comparisons of WT vs FUS (C1) and WT vs WT-FGF (C3)
HC phosphopeptides are shown where mean C1 or C3 ratio shows both a substantial (|log2(comparison ratio)| > 0.5) and a significant (using +/–1.96σ) change. Phosphosites observed in only one replicate are excluded. Error bars show 2 standard deviations (log corrected). Where available, reference proteome levels are indicated as grey boxes. Peptides also passing SigB significance shown as (*).
Figure 4
Figure 4. Differential pathway and network analysis process - DRAGON protocol - to identify networks specific to either FUS or WT signaling
DRAGON uniquely expands and filters protein interaction networks. Depicted multiple steps cover: (i) expansion of observed altered phosphosites to include predicted kinases; (ii) filtering by tissue expression; (iii) seeding and expansion of a general PPI network (the HSN) through a graph-kernel to create an effective network focused on each comparison; (iv) expansion of the proteins in each comparison using a module detection algorithm to give sets of proteins significantly implicated in signalling events; (v) enrichment in module sets for Reactome pathways; (vi) filtering by subtraction of pathway lists to remove identical hits in each comparison; (vii) filtering differential pathways to exclude those without at least one HC protein and (viii) detailed functional network expansion around specific pathways.
Figure 5
Figure 5. Overview of differentially regulated pathways derived from comparisons of WT vs FUS (C1) and WT vs WT-FGF (C3)
(A) Diagram showing overall connectivity. Reactome pathways uniquely affected in C1 (left, red numbered rectangles) or C3 (right, green numbered rectangles) are shown along with links to protein ‘hits’ on each pathway (ellipses). Pathways common to both conditions, but with differential involvement of proteins are shown in blue, with red or green borders indicating preferential C1 or C3 involvement respectively. Pathways and proteins that link the two conditions are shown if there is evidence of differential involvement and hidden otherwise. Pathways directly connected in the Reactome hierarchy (i.e. related) are connected with zigzags. Proteins are coloured according to their respective pathways (red: C1-only, green: C3-only, purple: linker between C1 & C3 and blue: part of a common pathway that may also link C1 or C3). Confidence of protein identification indicated by reference to HC (*, bold ellipse) or QP (bold ellipse) datasets. (B) Summary of proteins and the Reactome pathway descriptions for each differentially regulated Reactome pathway. Red: C1-only pathway / protein; green: C3-only; purple: protein linking C1-only and C3-only pathways; blue: pathway common to both C1 and C3 but with differentially involved proteins. Protein confidence levels: (*bold) - High, (bold) - Medium and (non-bold) - from network analyses. The pathways are numbered by increasing FDR, except where two have been merged.
Figure 6
Figure 6. Further analysis of the relationship between FUS and TP53 based on C1 Reactome pathways 3 and 4
(A) Network diagram expanding of local functional interactions around pathways for the regulation of TP53 expression and degradation (C1-only, 3 & 4). Observed phosphoproteins (ovals) and predicted interacting kinases (rectangles; hexagons if also substrate) shown with significant up or down regulated phosphosite changes (red/green lines respectively). (QP proteins medium grey border; HC thick grey border; proteome yellow border). The diagram shows the central importance of AKT1 in FUS in terms of multiple predicted functional interactions, including TP53, EIF4B, GSK3B and PDK1. AKT1, 2 and 3 all have functional interactions with either TP53 or MDM2. The role of the predicted ATM kinase in these interactions is supported by links to substrates LMNA and HMGA2. (B) Western blotting (left panel) showing p-ERK and TP53 levels in NHUC cells stably expressing FGFR3 (IIIb) WT or FGFR3-TACC3 and the RT112 cell line following stimulation with 100 ng/ml FGF1 and 100 IU/ml Heparin for the indicated time points. GAPDH was used as a loading control. Quantification of TP53 levels after 24-hour stimulation compared to unstimulated cells (right panel) shows that TP53 is significantly down-regulated in the RT112 cells and in the NHUC FGFR3-TACC3 expressing cells, whereas no change is seen in NHUC cells expressing FGFR3 (IIIb) WT (n = 4 separate blots from 2 biological repeats, ± SEM). Data was analysed by multiple one-sample t-tests to a normalised control of 1 with **P < 0.01 and ***P < 0.001.

References

    1. Belov AA, Mohammadi M. Molecular mechanisms of fibroblast growth factor signaling in physiology and pathology. Cold Spring Harb Perspect Biol. 2013;5:5. - PMC - PubMed
    1. Helsten T, Schwaederle M, Kurzrock R. Fibroblast growth factor receptor signaling in hereditary and neoplastic disease: biologic and clinical implications. Cancer Metastasis Rev. 2015;34:479–496. - PMC - PubMed
    1. Itoh N, Ornitz DM. Fibroblast growth factors: from molecular evolution to roles in development, metabolism and disease. J Biochem. 2011;149:121–130. - PMC - PubMed
    1. Touat M, Ileana E, Postel-Vinay S, Andre F, Soria JC. Targeting FGFR Signaling in Cancer. Clin Cancer Res. 2015;21:2684–2694. - PubMed
    1. Katoh M. Therapeutics Targeting FGF Signaling Network in Human Diseases. Trends Pharmacol Sci. 2016;37:1081–1096. - PubMed