. 2017 Oct 16;8(61):103931-103951.
doi: 10.18632/oncotarget.21879. eCollection 2017 Nov 28.

PARP inhibition causes premature loss of cohesion in cancer cells

Affiliations

PARP inhibition causes premature loss of cohesion in cancer cells

Eva Kukolj et al. Oncotarget. .

Abstract

Poly(ADP-ribose) polymerases (PARPs) regulate various aspects of cellular function including mitotic progression. Although PARP inhibitors have been undergoing various clinical trials and the PARP1/2 inhibitor olaparib was approved as monotherapy for BRCA-mutated ovarian cancer, their mode of action in killing tumour cells is not fully understood. We investigated the effect of PARP inhibition on mitosis in cancerous (cervical, ovary, breast and osteosarcoma) and non-cancerous cells by live-cell imaging. The clinically relevant inhibitor olaparib induced strong perturbations in mitosis, including problems with chromosome alignment at the metaphase plate, anaphase delay, and premature loss of cohesion (cohesion fatigue) after a prolonged metaphase arrest, resulting in sister chromatid scattering. PARP1 and PARP2 depletion suppressed the phenotype while PARP2 overexpression enhanced it, suggesting that olaparib-bound PARP1 and PARP2 rather than the lack of catalytic activity causes this phenotype. Olaparib-induced mitotic chromatid scattering was observed in various cancer cell lines with increased protein levels of PARP1 and PARP2, but not in non-cancer or cancer cell lines that expressed lower levels of PARP1 or PARP2. Interestingly, the sister chromatid scattering phenotype occurred only when olaparib was added during the S-phase preceding mitosis, suggesting that PARP1 and PARP2 entrapment at replication forks impairs sister chromatid cohesion. Clinically relevant DNA-damaging agents that impair replication progression such as topoisomerase inhibitors and cisplatin were also found to induce sister chromatid scattering and metaphase plate alignment problems, suggesting that these mitotic phenotypes are a common outcome of replication perturbation.

Keywords: PARP entrapment; PARP inhibitors; cohesion; live-cell imaging; mitosis.


Conflict of interest statement

CONFLICTS OF INTEREST The authors declare no conflicts of interest.

Figures
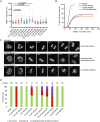
Figure 1
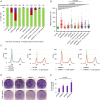
Figure 1. PARP1/2 inhibition causes anaphase delay and chromatid scattering (premature loss of cohesion) in HeLa cells
(A) Duration of NEBD-anaphase was analysed by live imaging of HeLa cells stably expressing H2B-mCherry EGFP-securin treated with PARP inhibitors for 30 h. Each dot represents one cell. (B) Cumulative frequency distribution representing both anaphase delay and inability to enter anaphase in cells treated with indicated concentrations of PARP inhibitors. (C) H2B-mCherry stills of representative mitotic phenotypes. Scale bar=10 μm. (D) Percentage of different mitotic phenotypes observed after treatment with PARP inhibitors for 30-37 h and MG132 as a positive control for 1 h.
Figure 2
Figure 2. PARP1 and PARP2 depletion rescue olaparib-induced scattering, S-phase stalling and cytotoxicity but not anaphase delay in HeLa
(A) Percentage of different mitotic phenotypes, (B) NEBD-anaphase duration, (C) flow cytometry analysis and (D-E) cell survival after concomitant treatment with olaparib and siPARP1/2 compared to single treatments. siPARP1 E and siPARP2 E were used. siCdc20 and siSORORIN were used as positive controls for live imaging and the cells were analysed 48-68 h after siRNA transfection. Imaged cells and FACS samples were analysed after 48 h of PARP silencing and 30 h of PARP inhibition. Cell survival was determined using colony formation assay 14 days after seeding. Cells were seeded 24 h after transfection with siRNAs and olaparib was added at the time of seeding.
Figure 3
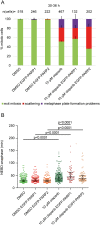
Figure 3. PARP2 overexpression exacerbates olaparib-induced scattering
(A) Percentage of different mitotic phenotypes and (B) NEBD-anaphase duration in EGFP-PARP1 or EGFP-PARP2-overexpressing HeLa cells imaged 30-36 h after treatment with 10 μM olaparib.
Figure 4
Figure 4. Premature loss of cohesion caused by olaparib is due to PARP inhibition in S-phase
(A) Duration of NEBD-anaphase analysed by live-cell imaging in HeLa cells stably expressing H2B-mCherry EGFP-securin treated for 1-4 h with indicated concentrations of olaparib. (B) Experimental workflow for olaparib exposure during different stages of the cell cycle. HeLa H2B-mCherry cells were transfected with EGFP-PCNA and synchronized by double thymidine block as shown with FACS profiles under (C). Olaparib was added ‘1’ during S-phase, ‘2’ during S and G2 phase, ‘3’ just before NEBD. (D) Western blot analysis showing efficient removal of olaparib at the end of S-phase. (E) Stills from spinning disc imaging and (F) quantification of representative mitotic phenotypes. Scale bar=10 μm.
Figure 5
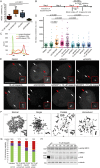
Figure 5. Scattering is a result of premature loss of cohesion caused by olaparib
(A) Comparison of NEBD-scattering duration induced by various treatments. Cells were treated with 10 μM olaparib for 24 h and 10 μM MG132 for 30 min. Cdc20 and sororin were depleted for 24 h with RNAi. Number of cells analysed per condition: n (olaparib) = 44, n (MG132) = 88, n (siCdc20) = 94, n (siSororin) = 63. (B) Experimental workflow for measuring sister chromatid distances. dCas9-mEGFP targeting Muc4 loci is induced, followed by mitotic shake-off, (i) 12 h growth and PARP inhibition for 4 h, or (ii) RNAi for 16 h before imaging of G2 cells. (C) FACS profiles showing synchronization of Muc4-labeled HeLa cells in S and G2 phase. (D) 3D distance between sister chromatids at Muc4 loci measured after live-cell imaging of PARP-inhibited or PARP/sororin-depleted cells. (E) Representative images quantified under (D). Scale bar=10 μm. (F) Representative images and (G) analysis of phenotypes revealed by Giemsa-stained chromosome spreads after addition of 10 μM olaparib. Scale bar=10 μm. (H) Olaparib does not affect SMC3 acetylation levels. Extracts from HeLa cells treated with 10 μM olaparib for various times were analysed by Western blotting.
Figure 6
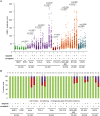
Figure 6. Olaparib causes anaphase delay and chromosome scattering in different cancer cell lines
(A) Duration of NEBD-anaphase in non-cancerous and cancerous cell lines after verapamil, olaparib or concomitant verapamil and olaparib treatment. Live-cell imaging was always performed for 50 h after olaparib addition. Different time frames were analysed for different cell lines for the following reasons. Earlier time points were analysed in the case of HME1 and RPE1, which did not divide after 36 h. Later time points were analysed in cell lines that were highly stalled by olaparib treatment. Green = non-cancerous cell lines, violet = cervical cancer cell lines, dark red = ovarian cancer cell line, orange = breast cancer cell lines and blue = osteosarcoma cancer cell line (B) Percentage of the observed mitotic phenotypes.
Figure 7
Figure 7. Cervical cancer cell lines HeLa and C33-A have high PARP1 and PARP2 mRNA and protein levels and are arrested in G2/M phase after olaparib treatment
(A) Relative PARP1 and PARP2 mRNA levels normalized to actin as a loading control. (B) Western blot analysis of PARP1 and PARP2 protein levels normalized to actin as a loading control. (C) Relative PAR levels normalized to actin as a loading control. The quantification is based on blots showing total PAR generated not only by PARP1/2. (D) Heat map showing correlations between scattering caused by olaparib and relative PARP1 and PARP2 protein levels. All values were normalized from 0-1. Dark red (1) represents the highest protein levels, strongest anaphase delay and highest degree of scattering, while white (0) represents the lowest values. (E) Flow cytometry analysis of cancerous and non-cancerous cell lines after olaparib treatment.
Figure 8
Figure 8. Replication stress and DNA damage after olaparib treatment
(A) Growth rate of various cell lines determined by cell counting over 4 days. (B) Relative increase of phospho-RPA levels in untreated vs 10 μM olaparib-treated cells for 30 h. Immunofluorescent phospho-RPA intensities were measured by ImageJ (n>100). Representative images for HME1 and cervical cell lines are shown. (C) Percentage of γH2AX positive cells in untreated and 10 μM olaparib-treated cells for 30 h. Cells were scored as γH2AX positive if the number of foci per nucleus was ≥5 (n>100). Representative images for HME1 and cervical cell lines are shown. (D) Representative images of γH2AX foci in mitotic cells treated with 10 μM olaparib for 30 h. Scale bar=10 μm.
Figure 9
Figure 9. Sister chromatid scattering is a general outcome of replication fork perturbations induced by various agents in HeLa
(A, B) Percentage of different mitotic phenotypes observed after (A) 20-28 h or (B) 30-36 h treatment with replication stress-inducing agents. (C) 3D distance between sister chromatids at Muc4 loci measured after live-cell imaging of HeLa cells treated with the same agents. Experimental workflow was as in Figure 5B for all agents except for hydroxyurea: 12 h after mitotic shake-off when cells are in S-phase agents were added for 4 h before imaging G2 cells. Cells were treated with 200 μM hydroxyurea for 20 h followed by 6 h recovery. (D) Representative images quantified under (C).
Figure 10
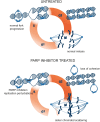
Figure 10. A model of mitotic cell death caused by premature loss of cohesion due to PARP inhibition with olaparib
PARP inhibition causes replication fork stalling and premature loss of cohesion in interphase. Mitotic cells are consequently arrested in metaphase, sister chromatids scatter away from the metaphase plate and the cells eventually die.

References

    1. De Vos M, Schreiber V, Dantzer F. The diverse roles and clinical relevance of PARPs in DNA damage repair: current state of the art. Biochem Pharmacol. 2012;84:137–146. - PubMed
    1. Luo X, Kraus WL. On PAR with PARP: cellular stress signaling through poly(ADP-ribose) and PARP-1. Genes Dev. 2012;26:417–432. - PMC - PubMed
    1. Kraus WL, Hottiger MO. PARP-1 and gene regulation: Progress and puzzles. Mol Aspects Med. 2013;34:1109–1023. - PubMed
    1. Barkauskaite E, Jankevicius G, Ahel I. Structures and Mechanisms of Enzymes Employed in the Synthesis and Degradation of PARP-Dependent Protein ADP-Ribosylation. Mol Cell. 2015;58:935–946. - PubMed
    1. Gibson BA, Kraus WL. New insights into the molecular and cellular functions of poly(ADP-ribose) and PARPs. Nature. 2012;13:411–424. - PubMed

LinkOut - more resources