. 2017 Oct 19;8(61):104007-104021.
doi: 10.18632/oncotarget.21945. eCollection 2017 Nov 28.

Microtubins: a novel class of small synthetic microtubule targeting drugs that inhibit cancer cell proliferation

Affiliations

Microtubins: a novel class of small synthetic microtubule targeting drugs that inhibit cancer cell proliferation

Silvia Senese et al. Oncotarget. .

Abstract

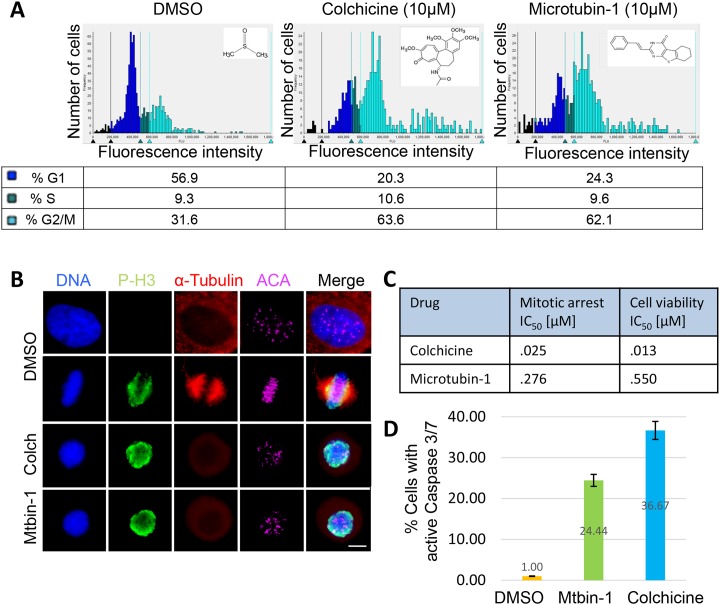
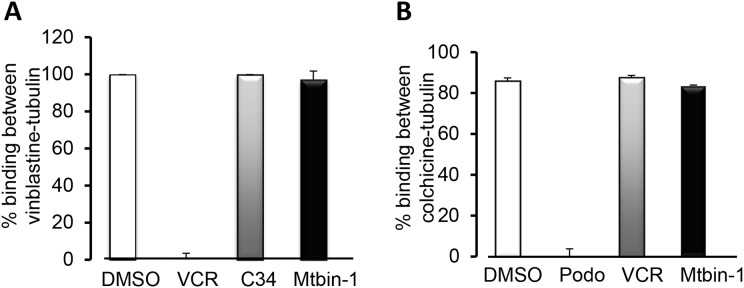
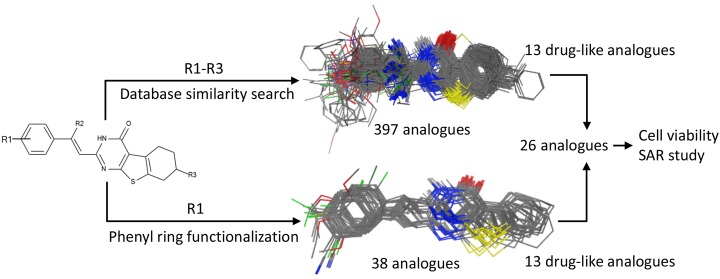
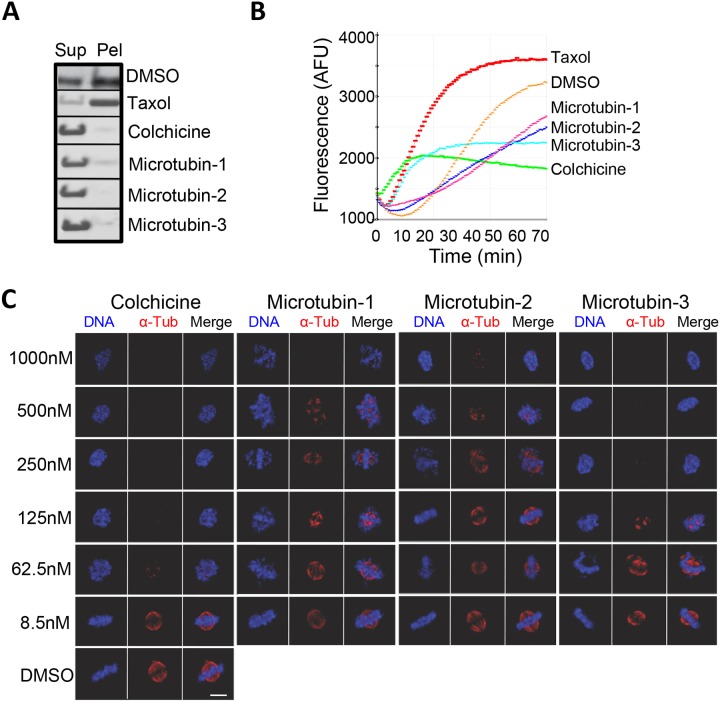
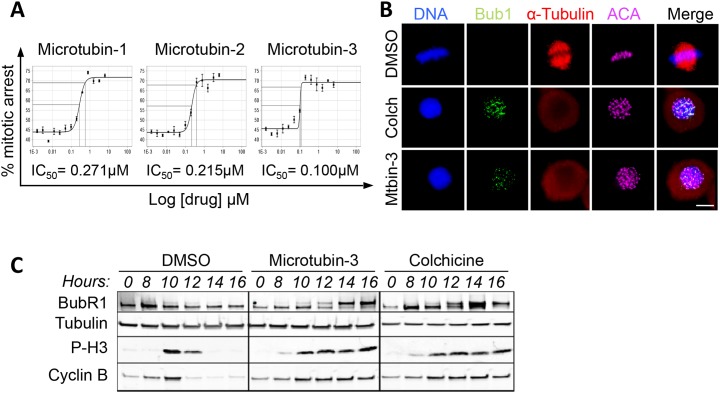
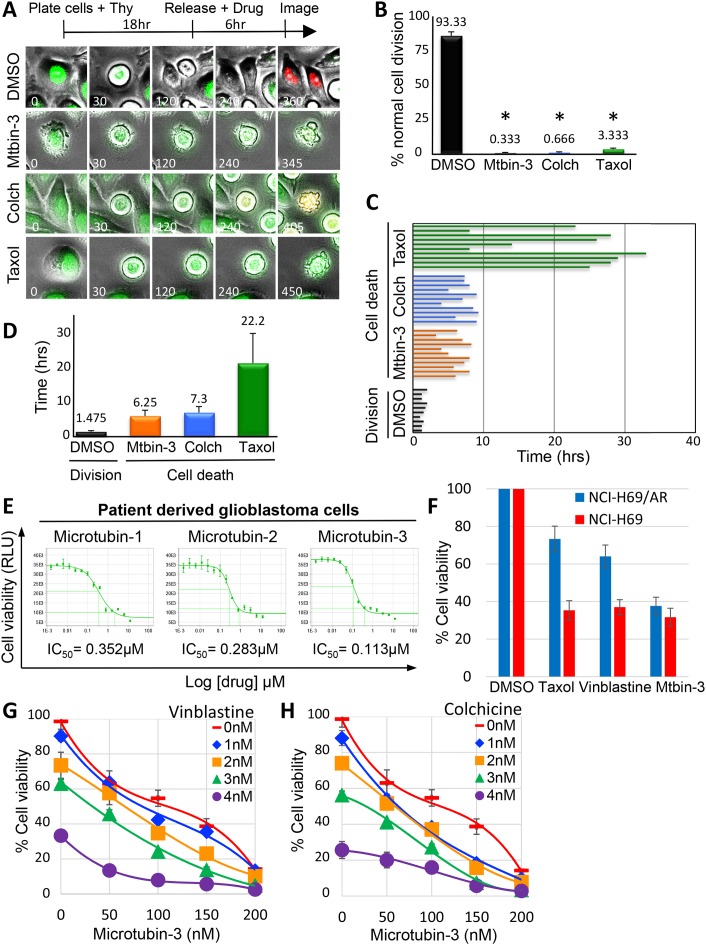
Microtubule targeting drugs like taxanes, vinca alkaloids, and epothilones are widely-used and effective chemotherapeutic agents that target the dynamic instability of microtubules and inhibit spindle functioning. However, these drugs have limitations associated with their production, solubility, efficacy and unwanted toxicities, thus driving the need to identify novel antimitotic drugs that can be used as anticancer agents. We have discovered and characterized the Microtubins (Microtubule inhibitors), a novel class of small synthetic compounds, which target tubulin to inhibit microtubule polymerization, arrest cancer cells predominantly in mitosis, activate the spindle assembly checkpoint and trigger an apoptotic cell death. Importantly, the Microtubins do not compete for the known vinca or colchicine binding sites. Additionally, through chemical synthesis and structure-activity relationship studies, we have determined that specific modifications to the Microtubin phenyl ring can activate or inhibit its bioactivity. Combined, these data define the Microtubins as a novel class of compounds that inhibit cancer cell proliferation by perturbing microtubule polymerization and they could be used to develop novel cancer therapeutics.

Keywords: cancer cell proliferation; cell cycle; cell division; microtubules; tubulin-targeting agents.


Conflict of interest statement

CONFLICTS OF INTEREST S.S., Y-C.L., R.D. and J.Z.T. are authors on a pending patent on the Microtubins. The other authors have no conflicts of interest to disclose.

Figures

Figure 1
Figure 1. Identification of Microtubin-1, a novel cell division inhibitor
(A), cell cycle histogram of HeLa cells treated with DMSO or 10 μM of either colchicine or Microtubin-1 for 20 hours. The chemical structures of DMSO, colchicine and Microtubin-1 are indicated next to their histograms. The percentage of cells in G1 phase, S phase and G2/M phase are indicated below the histogram for each treatment. (B), immunofluorescence microscopy of cells treated with DMSO or 10 μM of either colchicine or Microtubin-1 for 20 hours. Cells were fixed with 4% paraformaldehyde stained with Hoechst 33342 and anti-ɑ-tubulin and anti-Ser10-phospho-histone H3 antibodies to visualize the DNA, microtubule structures and mitotic cells, respectively. Bar indicates 5 μm. (C), HeLa cells were treated with increasing concentrations of colchicine and Microtubin-1 and the drug response dose curves were used to measure the mitotic arrest IC50s (Vybrant DyeCycle Green assay) and the cell viability IC50s (CellTiter-Glo assay) for each treatment. (D), HeLa cells were treated with DMSO, colchicine and Microtubin-1 for 24 hours and caspase 3/7 activity was measured using the Caspase-Glo 3/7 assay. Graph displays % cells undergoing apoptosis (with active caspase 3/7) on the y-axis and the indicated drug treatments on the x-axis. Error bars indicate standard deviations from 3 independent triplicate experiments.
Figure 2
Figure 2. Microtubin-1 does not compete for binding to the vinca-binding site or the colchicine-binding site
(A-B), mass spectrometry-based competitive binding assays to test the binding of Microtubin-1 (Mtbin-1) to the vinca (A) and colchicine (B) site. All compounds were tested at 100 μM. Graphs display % binding between vinblastine and tubulin (A) or colchicine and tubulin (B) on the y-axis and the indicated drugs used to compete the binding on the x-axis. Data represent the average ± SD. A, Microtubin-1 does not compete with vinblastine for binding to the vinca site compared to the positive control vincristine (VCR). C34 is the negative control compound 34. B, Microtubin-1 does not compete with colchicine for the colchicine site compared to the positive control podophyllotoxin (Podo).
Figure 3
Figure 3. Microtubin-1 optimization
A ligand similarity search identified 397 compounds with >80% ligand similarity with Microtubin-1. Additionally, the Topliss scheme for aromatic ring optimization was used to identify 38 Microtubin-1 phenyl ring derivatives. The top 13 drug-like analogues and 13 drug-like phenyl derivatives of Microtubin-1 were selected for testing in HeLa cell culture structure activity relationship studies.
Figure 4
Figure 4. The Microtubins inhibit microtubule polymerization in vitro and in cells
(A-B), in vitro microtubule polymerization reactions were carried out in the presence of DMSO, or 15 μM of taxol, colchicine, Microtubin-1, Microtubin-2, or Microtubin-3 for 70 minutes at 37°C. A, reaction products were subjected to centrifugal sedimentation and the supernatant (Sup) and pellet (Pel) fractions were resolved by SDS-PAGE and tubulin polymerization was visualized with Coomassie blue staining. B, microtubule polymerization was monitored over time every minute by measuring the absorbance at 340 nm. Graph displays fluorescence signal (in arbitrary fluorescence units) on the y-axis over time (in minutes) on the x-axis for the indicated drug treatments. (C), immunofluorescence microscopy of cells treated with DMSO or increasing concentrations of taxol, colchicine, Microtubin-1, Microtubin-2, or Microtubin-3 for 20 hours. Cells were fixed with 4% paraformaldehyde and stained with Hoechst 33342 and anti-ɑ-tubulin antibodies to visualize the DNA and microtubule structures, respectively. Bar indicates 5 μm.
Figure 5
Figure 5. The Microtubins arrest cells in mitosis with an active spindle assembly checkpoint
(A), HeLa cells were treated with increasing concentrations of Microtubin-1, Microtubin-2, or Microtubin-3 for 20 hours and the drug response dose curves were used to measure the mitotic arrest IC50s for each treatment. Graphs display % mitotic arrest on the y-axis and increasing concentrations of the indicated drugs on the x-axis. (B), immunofluorescence microscopy of cells treated with DMSO, colchicine (100 nM), and Microtubin-3 (100 nM) showing that Microtubin-3-treated cells arrest in mitosis with an activate spindle assembly checkpoint (Bub1 remains at the centromere/kinetochore region) similar to colchicine treatment. Bar indicates 5μm. (C), HeLa cells were arrested in G1/S, released into the cell cycle in the presence or absence of DMSO, colchicine (100 nM) or Microtubin-3 (100 nM) and protein extracts were immunoblotted at the indicated time points. Immunoblot analysis shows that Microtubin-3-treated cells arrest in mitosis (increased P-H3 signal) with an active spindle assembly checkpoint (BubR1 phosphorylation is present as a higher mobility band), similar to colchicine treatment. Experiment was performed three times. Shown are representative blots.
Figure 6
Figure 6. Live-cell analysis of Microtubin-induced cell death
(A), live-cell time-lapse microscopy of HeLa FUCCI cells treated with DMSO, colchicine (100 nM), Microtubin-3 (100 nM), or taxol (10 nM). Time is in minutes. See also Supplementary Videos 1-4. (B), the percentage of cells undergoing normal cell division was quantified for DMSO, colchicine, Microtubin-3, or taxol-treated cells. Graph displays % normal cell divisions on the y-axis for the indicated drug treatments on the x-axis. Data represent the average ± SD of 3 independent experiments, with 20 cells counted for each. Asterisks denotes p-value <.0001. (C), individual cells treated with indicated drugs were tracked over time using live-cell time-lapse microcopy and the length of time from mitotic entry to cell death was represented as a bar for each cell. (D), the length of time from mitotic entry to cell death was quantified for DMSO, colchicine, Microtubin-3, or taxol-treated cells. Graph displays time (in hours) on the y-axis for the indicated drug treatments on the x-axis. Data represent the average ± SD of 3 independent experiments, with 10 cells counted for each. (E), Microtubins are inhibitors of glioblastoma tumor cell proliferation. Patient-derived glioblastoma cells (HK-309) were treated with a fourteen point two-fold titration (1.5 nM to 12.5 μM) of Microtubin-1, Microtubin-2, or Microtubin-3 for 72 hours and their cell viability (CellTiter-Glo Assay) IC50 was determined. Graphs display cell viability on the y-axis (RLU indicates relative light units) and increasing concentrations of the indicated drugs on the x-axis. (F), Microtubin-3 inhibits multi-drug resistant small cell lung carcinoma cells. Parental NCI-H69 and multi-drug resistant NCI-H69/AR (overexpress MRP1) small cell lung carcinoma cells were treated with Microtubin-3 (200 nM), taxol (20 nM), or vinblastine (2.5 nM) at the indicated concentrations for 72 hours. Cell viability was then determined using the CellTiter-Glo assay. Graph displays % cell viability on the y-axis and the indicated drug treatments on the x-axis for NCI-H69 (red bars) NCI-H69/AR (blue bars) cell lines. Error bars indicate standard deviations from 3 independent triplicate experiments. (G-H), drug-drug interaction studies with Microtubin-3 and vinblastine (G) and Microtubin-3 and colchicine (H). HeLa cells were treated with increasing concentrations of Microtubin-3, vinblastine and colchicine alone or in combination for 48 hours and the drug response dose curves were used to measure the cell viability (CellTiter-Glo assay) for each treatment. Graphs display % cell viability on the y-axis and increasing concentrations of Microtubin-3 on the x-axis for each drug combination.

References

    1. Manchado E, Guillamot M, Malumbres M. Killing cells by targeting mitosis. Cell Death Differ. 2012;19:369–77. - PMC - PubMed
    1. Lansing TJ, McConnell RT, Duckett DR, Spehar GM, Knick VB, Hassler DF, Noro N, Furuta M, Emmitte KA, Gilmer TM, Mook RA, Jr, Cheung M. In vitro biological activity of a novel small-molecule inhibitor of polo-like kinase 1. Mol Cancer Ther. 2007;6:450–59. - PubMed
    1. Kapoor TM, Mayer TU, Coughlin ML, Mitchison TJ. Probing spindle assembly mechanisms with monastrol, a small molecule inhibitor of the mitotic kinesin, Eg5. J Cell Biol. 2000;150:975–88. - PMC - PubMed
    1. Dumontet C, Jordan MA. Microtubule-binding agents: a dynamic field of cancer therapeutics. Nat Rev Drug Discov. 2010;9:790–803. - PMC - PubMed
    1. Gascoigne KE, Taylor SS. Cancer cells display profound intra- and interline variation following prolonged exposure to antimitotic drugs. Cancer Cell. 2008;14:111–22. - PubMed