. 2017 Nov 10;8(61):104508-104524.
doi: 10.18632/oncotarget.22356. eCollection 2017 Nov 28.

hsa-miR-29c-3p regulates biological function of colorectal cancer by targeting SPARC

Affiliations

hsa-miR-29c-3p regulates biological function of colorectal cancer by targeting SPARC

Shitong Zhang et al. Oncotarget. .

Abstract

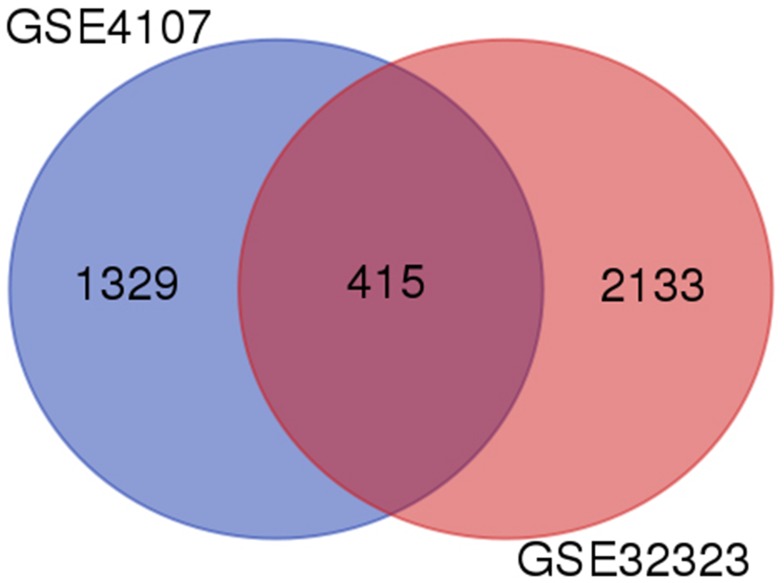
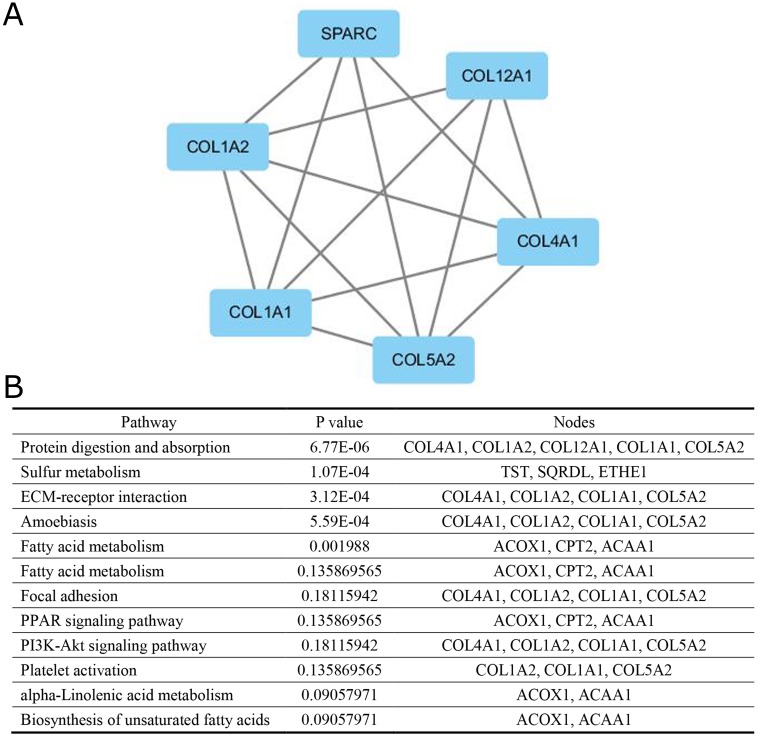
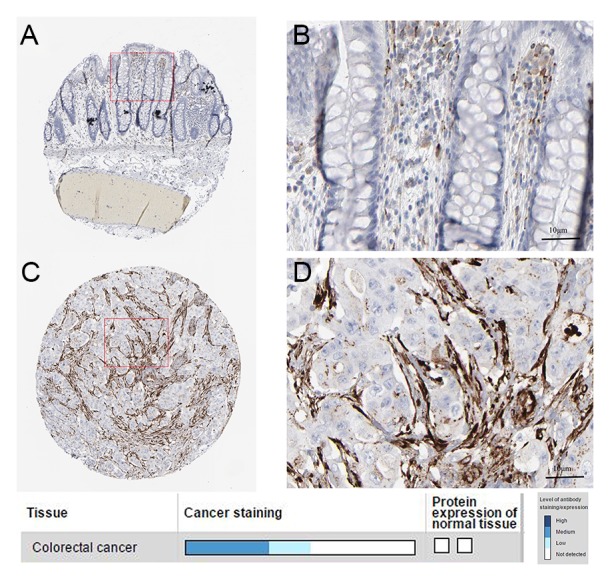
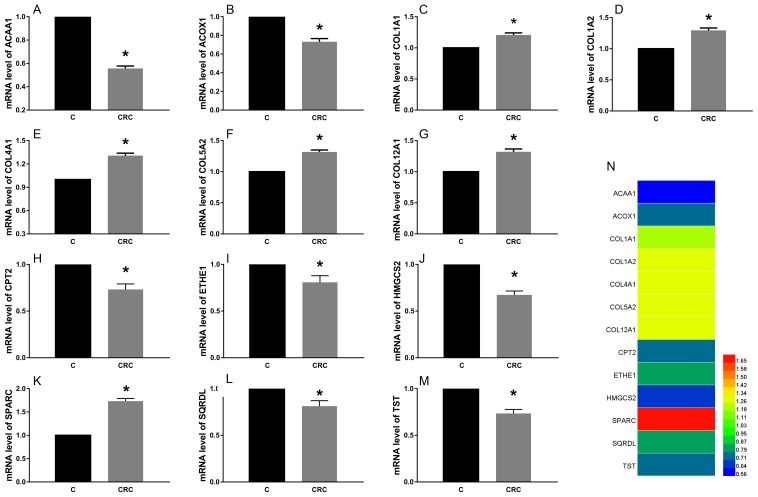
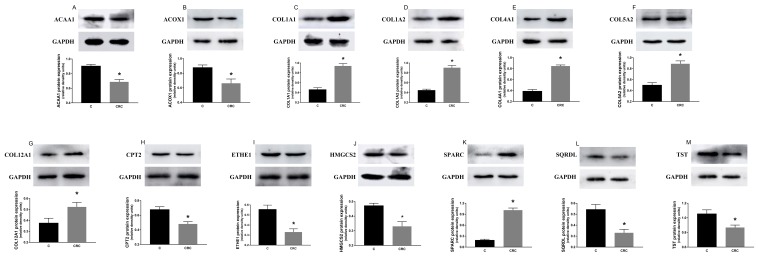
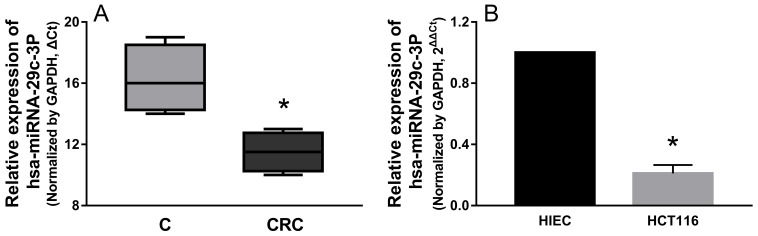
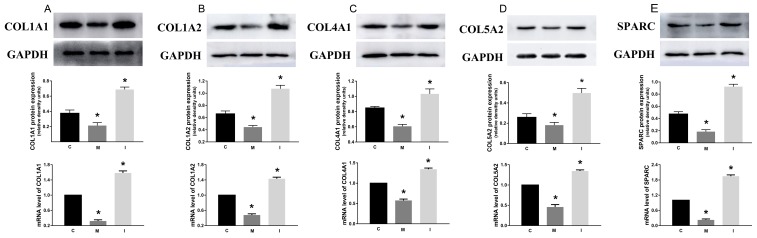
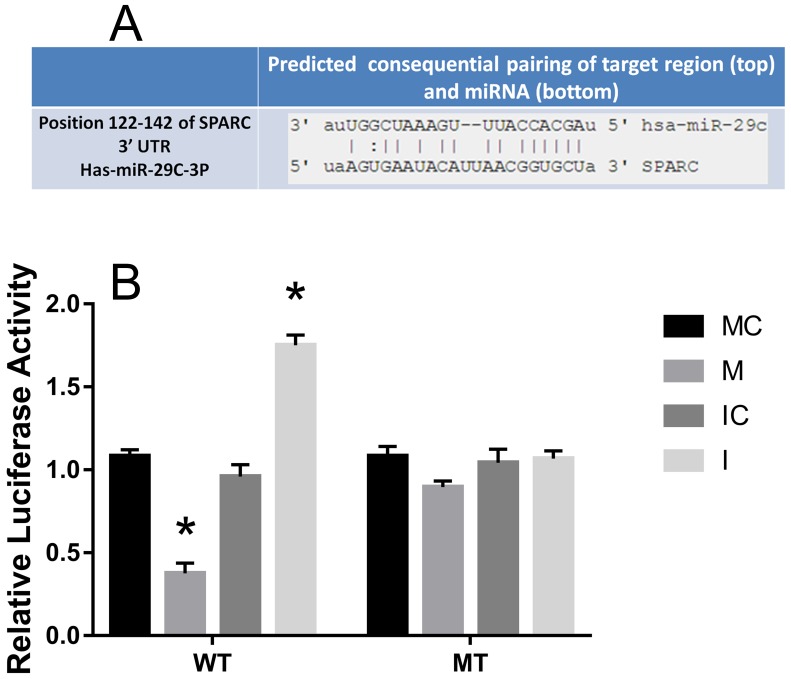
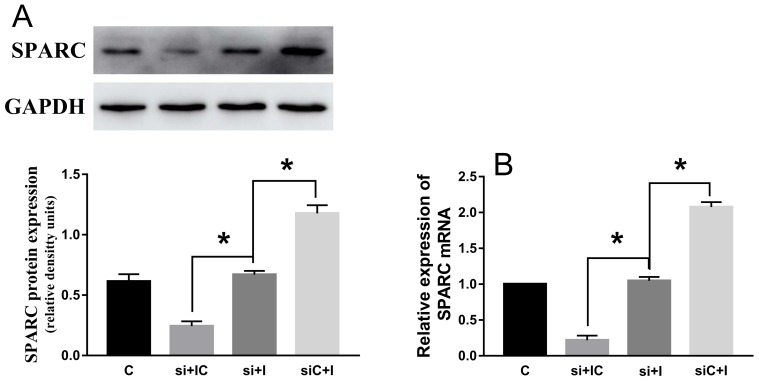
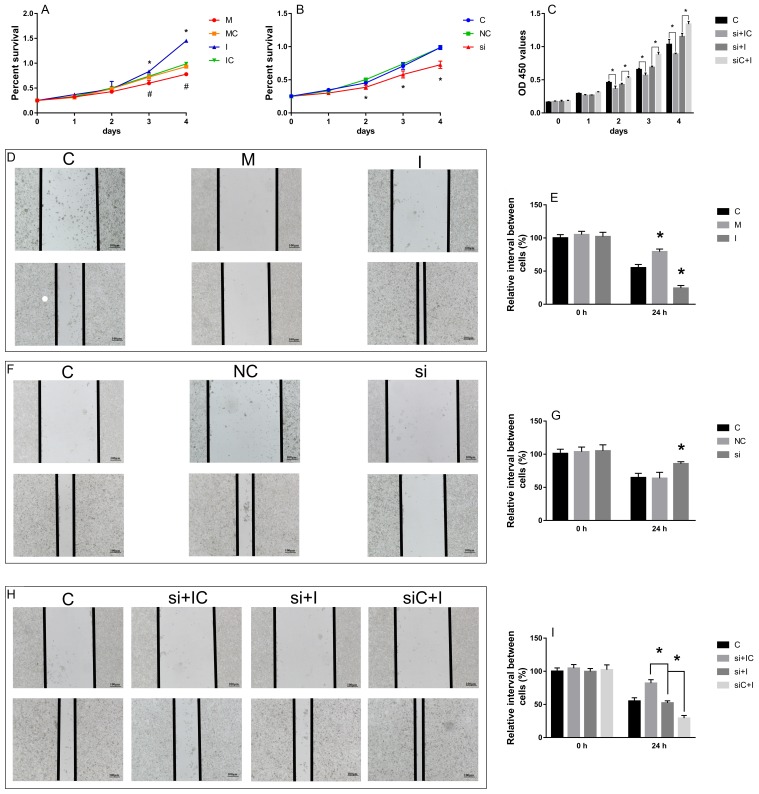
Colorectal cancer (CRC) is the most common type of behavioral cancers, miRNAs play a critical role in cancer development and progression. In the present study, we downloaded the original data from Gene Expression Omnibus (GEO) and conduct data analysis. has-mir-29c-3p mimic, inhibitor, negative control or si-SPARC (secreted protein acidic, rich in cysteine) were transfected into HCT116 cells, respectively. Quantitative real time PCR (qRT-PCR) was used to measure has-mir-29c-3p and SPARC mRNA expressions, western blot was used to detect ACAA1 (acetyl-CoA acyltransferase 1), ACOX1 (acyl-CoA oxidase 1), COL1A1(collagen, type I, alpha-1), COL1A2 (collagen, type I, alpha-2), COL4A1 (collagen, type IV, alpha-1), COL5A2 (collagen, type V, alpha-2), COL12A1 (collagen, type XII, alpha-1), CPT2 (carnitine palmitoyltransferase 2), ETHE1 (persulfide dioxygenase), HMGCS2 (3-hydroxy-3-methylglutaryl-CoA synthase 2), SPARC, SQRDL (sulfide quinone oxidoreductase), and TST (thiosulfate sulfurtransferase) protein expression. CCK-8 and wound healing assay were employed to verify cell proliferation and migration. The luciferase reporter assay data made sure the target correlation of has-mir-29c-3p and SPARC. Firstly, we found that the expression of has-mir-29c-3p was lower in CRC tissues than in their paired corresponding non-cancerous tissues and there was significant inversed correlation between has-mir-29c-3p and SPARC. Overexpression of has-mir-29c-3p reduced cell proliferation and migration. SPARC was identified as a direct target of has-mir-29c-3p, whose silencing reduced cell proliferation and migration. These data showed that has-mir-29c-3p regulates CRC cell functions through regulating SPARC expression. Taken together, has-mir-29c-3p may function as an oncogenic miRNA targeting SPARC, targeted modulation of has-mir-29c-3p expression may became a potential strategy for the treatment.

Keywords: SPARC; colorectal cancer; hsa-miR-29c-3p; migration; proliferation.


Conflict of interest statement

CONFLICTS OF INTEREST The authors declare no conflicts of interest.

Figures

Figure 1
Figure 1. Identification of differentially expressed genes in 554 mRNA expression profiling datasets GSE4107 and GSE32323
Figure 2
Figure 2. The protein–protein interaction network
(A) a module, (B) the enriched pathways of this module.
Figure 3
Figure 3. Immunohistochemistry
(A, B). normal tissue. (C, D) cancer tissue.
Figure 4
Figure 4. The expression of mRNA of these common differential genes in tissues
The expression levels of mRNA COL12A1 (G), COL1A2 (D), COL4A1 (E), SPARC (K), COL5A2 (F) and COL1A1 (C) was increased, while ACAA1 (A), ACOX1 (B), CPT2 (H), SQRDL (L), HMGCS2 (J), ETHE1 (I) and TST (M) were decreased. *P < 0.05.
Figure 5
Figure 5. The expression of proteins of these common differential genes in tissues
The expression levels of protein COL12A1 (G), COL1A2 (D), COL4A1 (E), SPARC (K), COL5A2 (F) and COL1A1 (C) was increased, while ACAA1 (A), ACOX1 (B), CPT2 (H), SQRDL (L), HMGCS2 (J), ETHE1 (I) and TST (M) were decreased. *P < 0.05.
Figure 6
Figure 6. hsa-miR-29c-3p was down-regulated in CRC tissues and cell lines
(A) The relative expression of hsa-miR-29c-3p in CRC tissues was lower compared with their paired corresponding noncancerous tissues. (B) The relative expression of hsa-miR-29c-3p was lower in CRC cells (HCT116 cells) than human epithelial cell line (HIEC) was detected by qRT-PCR. *P < 0.05.
Figure 7
Figure 7. The effect of hsa-miR-29c-3p on these up-regulated genes C group is the control group
I group is the hsa-miR-29c-3p inhibitor group. M. The hsa-miR-29c-3p mimic group. the mRNA of COL1A1 (A), COL1A2 (B), COL4A1 (C), COL5A2 (D), SPARC (E) was lowest in group I, followed by the group C, the highest was the group M. *P < 0.05.
Figure 8
Figure 8. SPARC was inversed with the expression of hsa-miR-29c-3p in CRC, as a direct target
(A) Predicted SRCIN1 3′-UTR binding site for hsa-miR-29c-3p. (B) The relative luciferase activity of the reporter gene in transfected CRC cells. MC group is the 576 mimic control group.M. the hsa-miR-29c-3p mimic group. IC group is the inhibitor control group. I group is the hsa-miR-29c-3p inhibitor group. *P < 0.05.
Figure 9
Figure 9. SPARC knock-down reduce the effect of hsa-miR-29c-3p up-expression in colorectal cancer cell
(A) The protein levels of SPARC in transfected cells were detected by Western blot. (B) The relative expression of SPARC mRNA in transfected CRC cell was detected by qRT-PCR. The hsa-miR-29c-3p inhibitor didn’t significantly promoted the expression of SPARC mRNA and protein in co-transfected HCT116 cells. C group is the control group. si + IC group is the si-SPARC + inhibitor control group. si + I group is the si-SPARC + inhibitor group. siC + I group is the si-SPARC control + inhibitor group. *P < 0.05.
Figure 10
Figure 10. The effect of hsa-miR-29c-3p and SPARC on cell migration and proliferation
(A-C) the CCK-8 assay. (D-I) the wound healing assay. *P < 0.05 (A) C group is the control group. I group is the hsa-miR-29c-3p inhibitor group. M. the hsa-miR-29c-3p mimic group. (B) C group is the control group. NC group is the negative control group. si group is the si-SPARC group. (C) C group is the control group. si + IC group is the si-SPARC + inhibitor control group. si + I group is the si-SPARC + inhibitor group. siC + I group is the si-SPARC control + inhibitor group.

References

    1. Jemal A, Bray F, Center MM, Ferlay J, Ward E, Forman D. Global cancer statistics. CA Cancer J Clin. 2011;61:69–90. https://doi.org/10.3322/caac.20107. - DOI - PubMed
    1. Brenner H, Kloor M, Pox CP. Colorectal cancer. Lancet. 2014;383:1490–502. https://doi.org/10.1016/S0140-6736(13)61649-9. - DOI - PubMed
    1. Marmol I, Sanchez-de-Diego C, Pradilla Dieste A, Cerrada E, Rodriguez Yoldi MJ. Colorectal Carcinoma: A General Overview and Future Perspectives in Colorectal Cancer. Int J Mol Sci. 2017;18 https://doi.org/10.3390/ijms18010197. - DOI - PMC - PubMed
    1. Brody H. Colorectal cancer. Nature. 2015;521:S1. https://doi.org/10.1038/521S1a. - DOI - PubMed
    1. Shi S, Yang J, Sun D. CT-guided 125I brachytherapy on pulmonary metastases after resection of colorectal cancer: A report of six cases. Oncol Lett. 2015;9:375–80. https://doi.org/10.3892/ol.2014.2649. - DOI - PMC - PubMed

LinkOut - more resources