

Examining the validity and utility of two secondary sources of food environment data against street audits in England
- PMID: 29262827
- PMCID: PMC5738834
- DOI: 10.1186/s12937-017-0302-1
Examining the validity and utility of two secondary sources of food environment data against street audits in England
Abstract
Background: Secondary data containing the locations of food outlets is increasingly used in nutrition and obesity research and policy. However, evidence evaluating these data is limited. This study validates two sources of secondary food environment data: Ordnance Survey Points of Interest data (POI) and food hygiene data from the Food Standards Agency (FSA), against street audits in England and appraises the utility of these data.
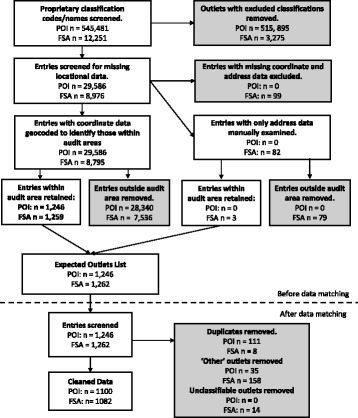
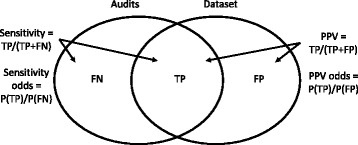
Methods: Audits were conducted across 52 Lower Super Output Areas in England. All streets within each Lower Super Output Area were covered to identify the name and street address of all food outlets therein. Audit-identified outlets were matched to outlets in the POI and FSA data to identify true positives (TP: outlets in both the audits and the POI/FSA data), false positives (FP: outlets in the POI/FSA data only) and false negatives (FN: outlets in the audits only). Agreement was assessed using positive predictive values (PPV: TP/(TP + FP)) and sensitivities (TP/(TP + FN)). Variations in sensitivities and PPVs across environment and outlet types were assessed using multi-level logistic regression. Proprietary classifications within the POI data were additionally used to classify outlets, and agreement between audit-derived and POI-derived classifications was assessed.
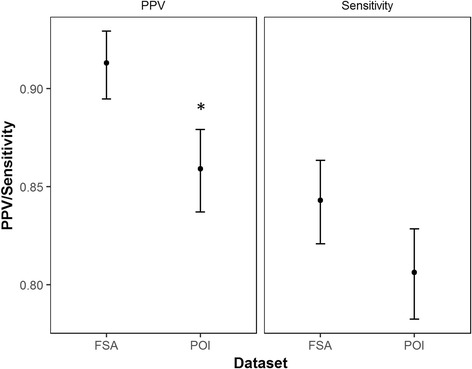
Results: Street audits identified 1172 outlets, compared to 1100 and 1082 for POI and FSA respectively. PPVs were statistically significantly higher for FSA (0.91, CI: 0.89-0.93) than for POI (0.86, CI: 0.84-0.88). However, sensitivity values were not different between the two datasets. Sensitivity and PPVs varied across outlet types for both datasets. Without accounting for this, POI had statistically significantly better PPVs in rural and affluent areas. After accounting for variability across outlet types, FSA had statistically significantly better sensitivity in rural areas and worse sensitivity in rural middle affluence areas (relative to deprived). Audit-derived and POI-derived classifications exhibited substantial agreement (p < 0.001; Kappa = 0.66, CI: 0.63-0.70).
Conclusions: POI and FSA data have good agreement with street audits; although both datasets had geographic biases which may need to be accounted for in analyses. Use of POI proprietary classifications is an accurate method for classifying outlets, providing time savings compared to manual classification of outlets.
Keywords: Foodscape; Sensitivity; Validity; ‘Administrative data’; ‘Commercial business list’; ‘Obesogenic environments’; ‘Positive predictive value’; ‘Retail food environment’; ‘Secondary data’; ‘Street audit’.
Conflict of interest statement
Ethics approval and consent to participate
Not applicable.
Consent for publication
Not applicable.
Competing interests
The authors declare that they have no competing interests.
Publisher’s Note
Springer Nature remains neutral with regard to jurisdictional claims in published maps and institutional affiliations.
Figures
References
-
- Butland B, Jebb S, Kopelman P, McPherson K, Thomas S, Mardell J, Parry V. In: Foresight. Tackling obesities: future choices. Project report. Foresight tackling obesities: future choices project report. GOf S, editor. London: Stationary Office; 2007. pp. 1–164.
-
- Ross A, Chang, M. Planning healthyweight environments – a TCPA reuniting health with planning project. 2014. https://www.tcpa.org.uk/healthyplanning. Accessed 1 Sept 2016.
-
- Local Government Association . Building the foundations - tackling obesity through planning and development. London: Local Government Association; 2016.
-
- NHS London Healthy Urban Development Unit. Using the planning system to control hot food takeaways. A good practice Guide. 2013. http://www.healthyurbandevelopment.nhs.uk/wp-content/uploads/2013/12/HUD.... Accessed 30 May 2016.
-
- Local Government Association . Tipping the scales. Case studies on the use of planning powers to limit hot food takeaways. London: Local Government Association; 2016.
Publication types
MeSH terms
LinkOut - more resources
Full Text Sources
Other Literature Sources
Miscellaneous
