. 2018 Mar 5;217(3):1143-1154.
doi: 10.1083/jcb.201709115. Epub 2017 Dec 20.

A toolbox of anti-mouse and anti-rabbit IgG secondary nanobodies

Affiliations

A toolbox of anti-mouse and anti-rabbit IgG secondary nanobodies

Tino Pleiner et al. J Cell Biol. .

Abstract

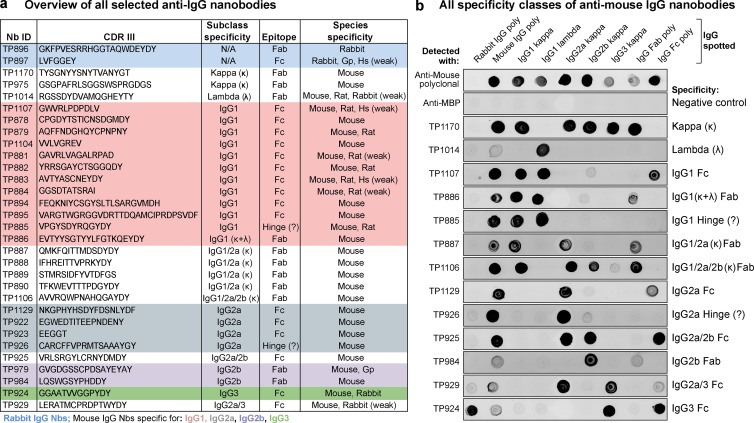
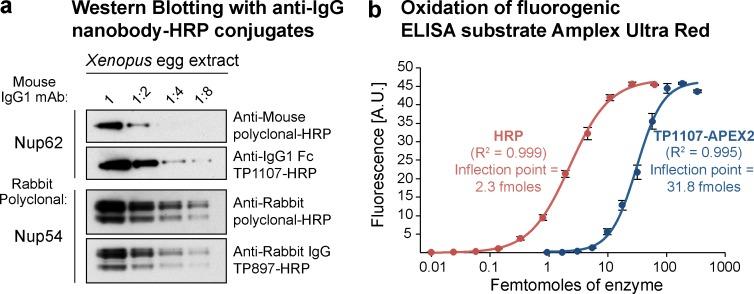
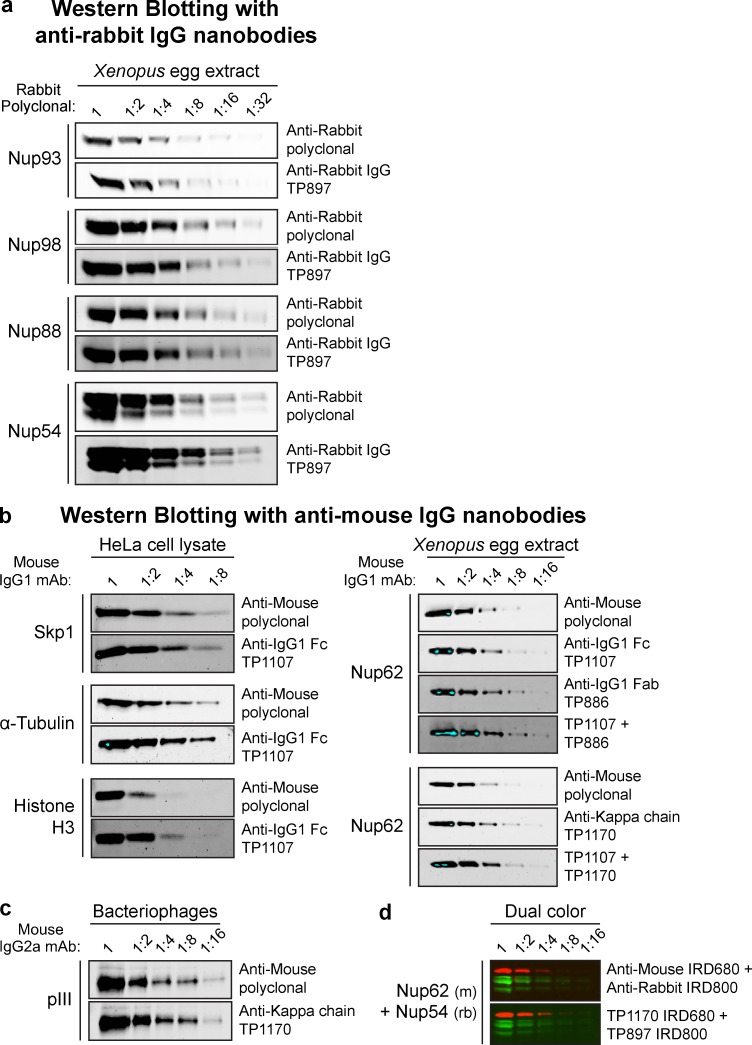
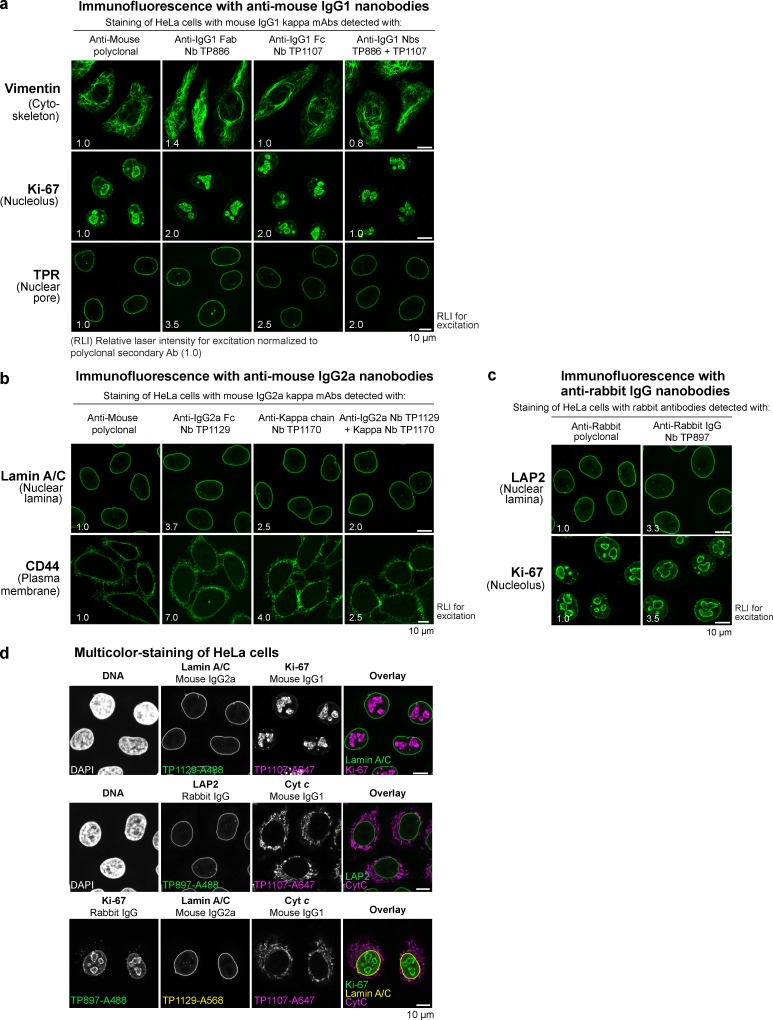
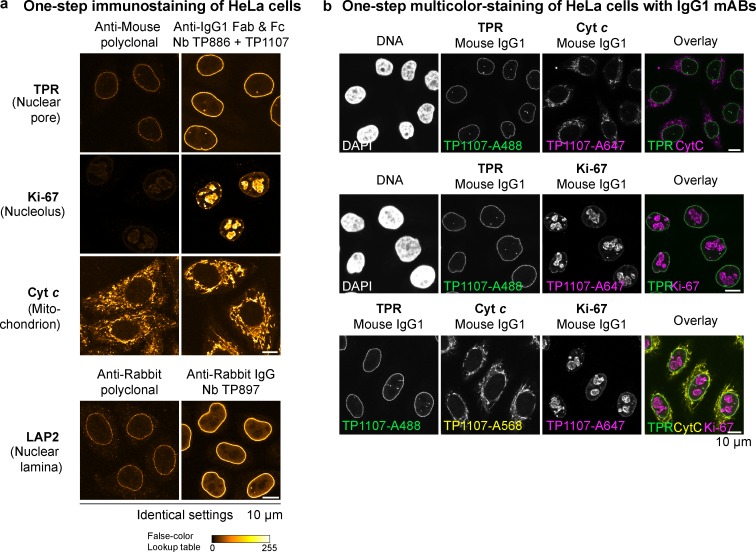
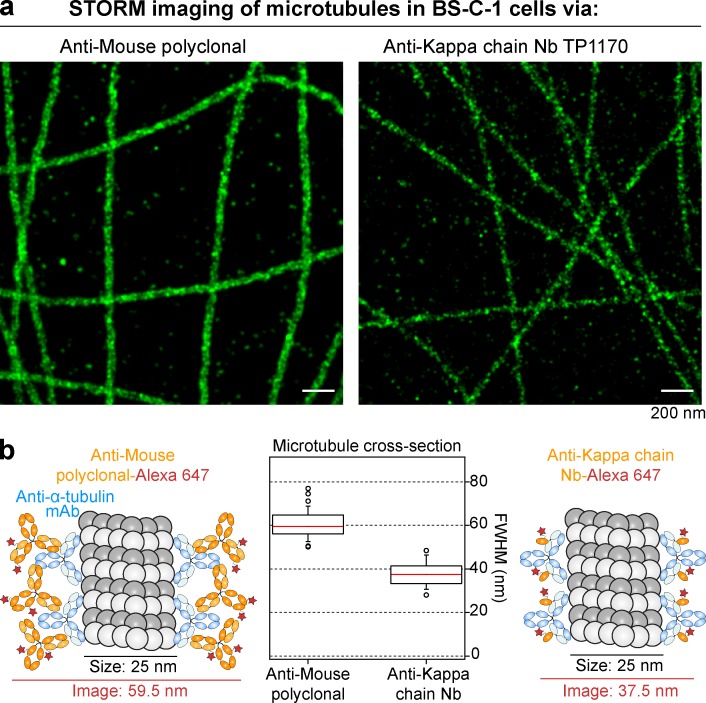
Polyclonal anti-immunoglobulin G (anti-IgG) secondary antibodies are essential tools for many molecular biology techniques and diagnostic tests. Their animal-based production is, however, a major ethical problem. Here, we introduce a sustainable alternative, namely nanobodies against all mouse IgG subclasses and rabbit IgG. They can be produced at large scale in Escherichia coli and could thus make secondary antibody production in animals obsolete. Their recombinant nature allows fusion with affinity tags or reporter enzymes as well as efficient maleimide chemistry for fluorophore coupling. We demonstrate their superior performance in Western blotting, in both peroxidase- and fluorophore-linked form. Their site-specific labeling with multiple fluorophores creates bright imaging reagents for confocal and superresolution microscopy with much smaller label displacement than traditional secondary antibodies. They also enable simpler and faster immunostaining protocols, and allow multitarget localization with primary IgGs from the same species and of the same class.


Figures

Figure 1.
Figure 1.
Characterization of the anti-IgG nanobody toolbox. (a) Overview of all identified anti-IgG nanobodies. The nanobodies obtained were characterized for IgG subclass and light chain specificity, epitope location on Fab or Fc fragment, and species cross reactivity. The protein sequences of all anti-IgG nanobodies can be found in Table S1. Nb, nanobody; CDR III, complementarity-determining region III; Gp, guinea pig; Hs, human; κ, κ light chain; λ, lambda light chain; Fab, fragment antigen-binding, Fc, fragment crystallizable. (b) IgG subclass reactivity profiling of selected anti–mouse IgG nanobodies representing all identified specificity groups. The indicated IgG species were spotted on nitrocellulose strips, and the strips were blocked with 4% (wt/vol) milk in 1× PBS. Then 300 nM of the indicated tagged nanobodies were added in milk. After washing with 1× PBS, bound nanobodies were detected using a fluorescence scanner. Note that the signal strength on polyclonal IgG depends on the relative abundance of the specific subclass (e.g., IgG2b and IgG3 are low abundance) or light chain (κ/λ ratio = 99:1). TP885 and TP926 showed no detectable binding to polyclonal Fab or Fc fragment and might bind to the hinge region. MBP, maltose binding protein; poly, polyclonal.
Figure 2.
Figure 2.
Application of peroxidase-linked anti-IgG nanobodies. (a) A twofold dilution series of Xenopus egg extract was blotted and probed with anti-Nup62 mouse IgG1 mAb A225. It was then decorated with HRP-conjugated goat anti–mouse polyclonal IgG (5 nM) or anti–mouse IgG1 Fc nanobody TP1107 (5 nM) and detected via ECL. Similarly, a rabbit polyclonal antibody targeting Nup54 was decorated with HRP-conjugated goat anti–rabbit polyclonal IgG or anti–rabbit IgG nanobody TP897 (5 nM). (b) Oxidation of the fluorogenic ELISA substrate Amplex Ultra Red. A dilution series of pure HRP or recombinant anti–mouse IgG1 Fc nanobody TP1107–APEX2 fusion was incubated with Amplex Ultra Red and H2O2. Oxidation leads to formation of the fluorescent compound resorufin. The data obtained were fit with a four-parameter logistic regression. The inflection points of the curves can be used to compare attainable sensitivity. A.U., arbitrary units. Error bars, mean ± SD (n = 3).
Figure 3.
Figure 3.
Western blotting with infrared dye–labeled anti-IgG nanobodies. (a) A twofold dilution series of Xenopus egg extract was analyzed by SDS-PAGE and Western blotting. The indicated rabbit polyclonal antibodies were used to detect Nups. These primary antibodies were then decorated via either IRDye 800–labeled goat anti–rabbit polyclonal IgG (1:5,000; LI-COR Biosciences) or anti–rabbit IgG nanobody TP897 (10 nM). Blots were analyzed with an Odyssey Infrared Imaging System (LI-COR Biosciences). (b) Left: A twofold dilution series of HeLa cell lysate was analyzed by SDS-PAGE and Western blotting. The indicated mouse IgG1 mAbs were decorated via either IRDye 800–labeled goat anti–mouse polyclonal IgG (1:1,340, 5 nM; LI-COR Biosciences) or anti–mouse IgG1 Fc nanobody TP1107 (5 nM). Right: A twofold dilution series of Xenopus egg extract was blotted and probed with anti-Nup62 mouse IgG1 mAb A225. It was then detected via IRDye 800–labeled goat anti-mouse polyclonal IgG (5 nM), anti–mouse IgG1 Fc nanobody TP1107 (5 nM), anti–mouse IgG1 Fab nanobody TP886 (5 nM), anti–mouse κ chain nanobody TP1170 (2.5 nM), or a combination of TP1107 and TP886 or TP1107 and TP1170. Blue pixels indicate signal saturation. (c) A dilution series of filamentous bacteriophages was blotted and probed with an anti–minor coat protein pIII mouse IgG2a mAb. It was then decorated via either IRDye 800–labeled goat anti-mouse polyclonal IgG (2.5 nM) or anti–mouse κ chain nanobody TP1170 (2.5 nM). (d) Dual-color Western blotting. A twofold dilution series of Xenopus egg extract was blotted and probed with anti-Nup62 mouse IgG1 mAb A225 and rabbit anti-Nup54 polyclonal antibody. These primary antibodies were then detected via IRDye 800–labeled goat anti–rabbit polyclonal IgG and IRDye 680–labeled goat anti–mouse polyclonal IgG. Alternatively, they were detected with TP1107 coupled to IRDye 680 and TP897 coupled to IRDye 800.
Figure 4.
Figure 4.
Imaging with anti-IgG nanobodies. (a) Immunofluorescence with anti–mouse IgG1 nanobodies. HeLa cells were stained with the indicated mouse IgG1 κ mAbs. These primary antibodies were then detected with Alexa Fluor 488–labeled goat anti-mouse polyclonal antibody, anti–mouse IgG1 Fab nanobody TP886, or anti–mouse IgG1 Fc nanobody TP1107. A combination of TP886 and TP1107 yielded increased staining intensities. Laser intensities used to acquire the anti-IgG nanobody images were normalized to the intensity used to acquire the anti-mouse polyclonal antibody image (RLI, relative laser intensity used for excitation under otherwise identical settings serves as a measure of fluorescence signal strength). (b) Immunofluorescence with anti–mouse IgG2a nanobodies. HeLa cells were stained with the indicated mouse IgG2a mAbs. These primary antibodies were then detected with Alexa Fluor 488–labeled goat anti-mouse polyclonal antibody, anti–mouse IgG2a Fc nanobody TP1129, or anti–κ chain nanobody TP1170. A combination of TP1129 and TP1170 yielded increased staining intensities. (c) Immunofluorescence with anti–rabbit IgG nanobody TP897. HeLa cells were stained with the indicated rabbit antibodies. These primary antibodies were then detected with Alexa Fluor 488–labeled goat anti-rabbit polyclonal antibody or anti–rabbit IgG nanobody TP897. (d) Multicolor staining of HeLa cells. HeLa cells were incubated with the indicated mouse IgG1, mouse IgG2a, or rabbit IgG antibodies. These primary antibodies were detected via anti–mouse IgG1 Fc nanobody TP1107, anti–mouse IgG2a Fc nanobody TP1129, or anti–rabbit IgG nanobody TP897, respectively, labeled with the indicated Alexa Fluor dyes. The top two panels show dual colocalization, and the bottom panel shows a triple colocalization.
Figure 5.
Figure 5.
One-step immunostaining of HeLa cells with anti-IgG nanobodies. (a) The indicated mouse IgG1 mAbs were preincubated with an equal amount of Alexa Fluor 488–labeled goat anti-mouse secondary antibody or a combination of anti–mouse IgG1 Fab nanobody TP886 and anti–mouse IgG1 Fc nanobody TP1107. Likewise, the anti-LAP2 rabbit polyclonal antibody was preincubated with either Alexa Fluor 488–labeled goat anti-rabbit secondary antibody or anti–rabbit IgG nanobody TP897. The resulting mixes were then applied to fixed and blocked HeLa cells. After washing, the cells were directly mounted for imaging. For every primary antibody, images were acquired under identical settings, and pixel intensities are represented via a false-color lookup table. (b) Multicolor staining of HeLa cells with mouse IgG1 subclass mAbs. The indicated mouse IgG1 mAbs were separately preincubated with Alexa Fluor 488–, Alexa Fluor 568–, or Alexa Fluor 647–coupled anti–mouse IgG1 Fc nanobody TP1107 and then mixed before staining HeLa cells in a single step. Washed cells were directly mounted for imaging.
Figure 6.
Figure 6.
STORM imaging with anti–κ chain nanobody TP1170. (a) BS-C-1 cells were stained with an anti–α tubulin monoclonal antibody (IgG1 κ) and detected with Alexa Fluor 647–labeled goat anti-mouse polyclonal antibody or Alexa Fluor 647–labeled anti–mouse κ chain nanobody TP1170. STORM images of the two samples show subdiffraction limit organization of the tubulin filaments. (b) To quantify the effect of the label size on the apparent width of the filaments in the STORM images, averaged cross-sectional profiles of straight segments of filaments from the two samples were measured. First, the two labeling approaches are illustrated on the left and right of the figure, showing the expected smaller width for the nanobody labeling case. In the middle, box plots illustrate the results of the width analysis (boxes indicate first and third quartiles of data values, whereas the red line indicates the median value; error bars indicate the 10th and 90th percentiles). In these measurements, the median width of the tubulin filaments decreased by a significant amount (from 59.5 to 37.5 nm) when stained with the anti–mouse κ chain nanobody TP1170.

Comment in

References

    1. Arbabi Ghahroudi M., Desmyter A., Wyns L., Hamers R., and Muyldermans S.. 1997. Selection and identification of single domain antibody fragments from camel heavy-chain antibodies. FEBS Lett. 414:521–526. 10.1016/S0014-5793(97)01062-4 - DOI - PubMed
    1. Balzarotti F., Eilers Y., Gwosch K.C., Gynnå A.H., Westphal V., Stefani F.D., Elf J., and Hell S.W.. 2017. Nanometer resolution imaging and tracking of fluorescent molecules with minimal photon fluxes. Science. 355:606–612. 10.1126/science.aak9913 - DOI - PubMed
    1. Bates M., Huang B., Dempsey G.T., and Zhuang X.. 2007. Multicolor super-resolution imaging with photo-switchable fluorescent probes. Science. 317:1749–1753. 10.1126/science.1146598 - DOI - PMC - PubMed
    1. Bates M., Huang B., and Zhuang X.. 2008. Super-resolution microscopy by nanoscale localization of photo-switchable fluorescent probes. Curr. Opin. Chem. Biol. 12:505–514. 10.1016/j.cbpa.2008.08.008 - DOI - PMC - PubMed
    1. Bates M., Dempsey G.T., Chen K.H., and Zhuang X.. 2012. Multicolor super-resolution fluorescence imaging via multi-parameter fluorophore detection. ChemPhysChem. 13:99–107. 10.1002/cphc.201100735 - DOI - PMC - PubMed

Publication types

MeSH terms