

Hemolysis during and after 21 days of head-down-tilt bed rest
- PMID: 29263114
- PMCID: PMC5742697
- DOI: 10.14814/phy2.13469
Hemolysis during and after 21 days of head-down-tilt bed rest
Abstract
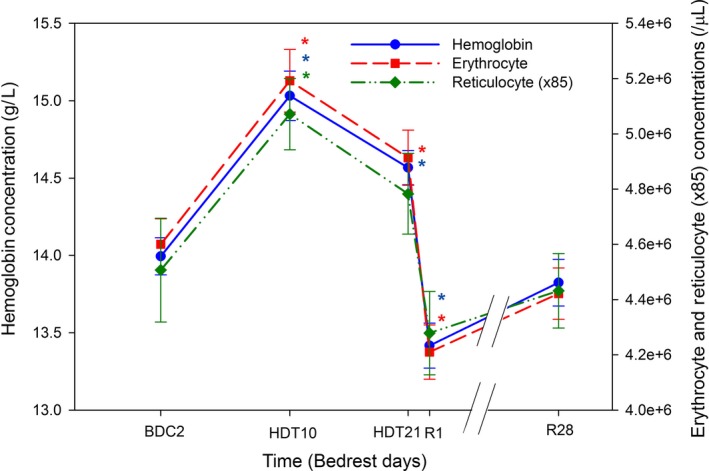
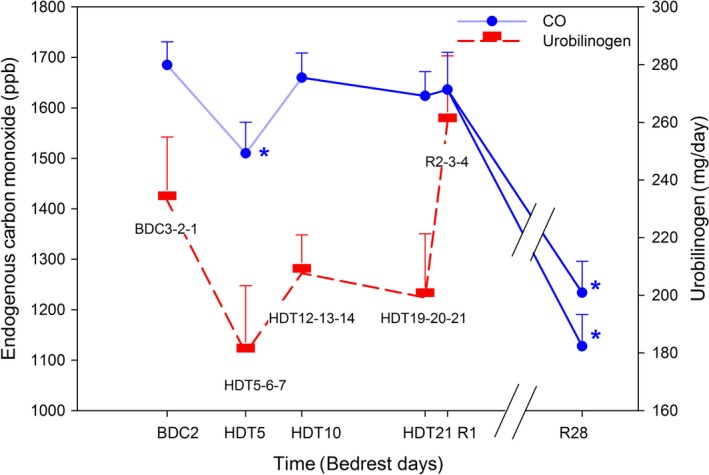
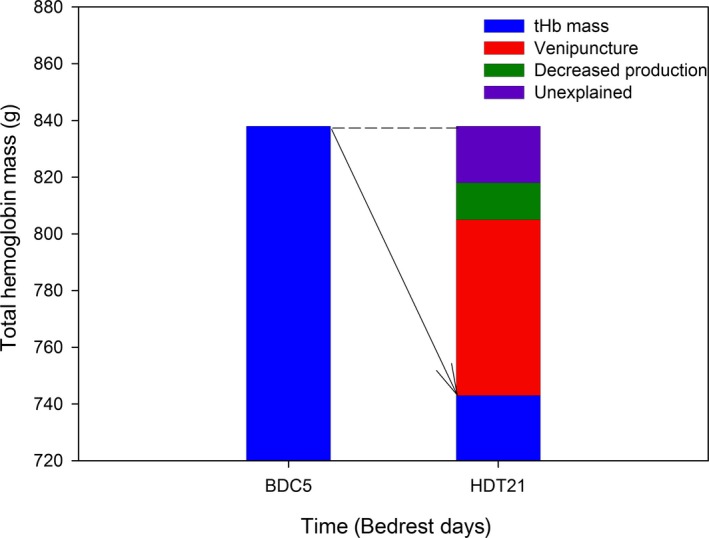
Hemoconcentration is observed in bed rest studies, descent from altitude, and exposure to microgravity. Hemoconcentration triggers erythrocyte losses to subsequently normalize erythrocyte concentration. The mechanisms of erythrocyte loss may involve enhanced hemolysis, but has never been measured directly in bed rest studies. Steady-state hemolysis was evaluated by measuring two heme degradation products, endogenous carbon monoxide concentration [CO] and urobilinogen in feces, in 10 healthy men, before, during, and after two campaigns of 21 days of 6° head-down-tilt (HDT) bed rest. The subjects were hemoconcentrated at 10 and 21 days of bed rest: mean concentrations of hemoglobin (15.0 ± 0.2 g/L and 14.6 ± 0.1 g/L, respectively) and erythrocytes (5.18 ± 0.06E6/μL and 5.02 ± 0.06E6/μL, respectively) were increased compared to baseline (all Ps < 0.05). In contrast, mean hemoglobin mass (743 ± 19 g) and number of erythrocytes (2.56 ± 0.07E13) were decreased at 21 days of bed rest (both Ps < 0.05). Indicators of hemolysis mean [CO] (1660 ± 49 ppb and 1624 ± 48 ppb, respectively) and fecal urobilinogen concentration (180 ± 23 mg/day and 199 ± 22 mg/day, respectively) were unchanged at 10 and 21 days of bed rest compared to baseline (both Ps > 0.05). A significant decrease in [CO] (-505 ppb) was measured at day 28 after bed rest. HDT bed rest caused hemoconcentration in parallel with lower hemoglobin mass. Circulating indicators of hemolysis remained unchanged throughout bed rest supporting that enhanced hemolysis did not contribute significantly to erythrocyte loss during the hemoconcentration of bed rest. At day 28 after bed rest, decreased hemolysis accompanied the recovery of erythrocytes, a novel finding.
Keywords: Carbon monoxide; head‐down‐tilt bed rest; hemolysis; urobilinogen.
© 2017 The Authors. Physiological Reports published by Wiley Periodicals, Inc. on behalf of The Physiological Society and the American Physiological Society.
Figures
References
-
- Alfrey, C. P. , Udden M. M., Leach‐Huntoon C., Driscoll T., and Pickett M. H.. 1996. Control of red blood cell mass in spaceflight. J. Appl. Physiol. 81:98–104. - PubMed
-
- Alfrey, C. P. , Rice L., Udden M. M., and Driscoll T. B.. 1997. Neocytolysis: physiological down‐regulator of red‐cell mass. Lancet 349:1389–1390. - PubMed
-
- Beris, P. , and Picard V.. 2015. Non‐immune hemolysis: diagnostic considerations. Semin. Hematol. 52:287–303. - PubMed
-
- Berlin, N. I. 1975. Diagnosis and classification of the polycythemias. Semin. Hematol. 12:339–351. - PubMed
Publication types
MeSH terms
Substances
LinkOut - more resources
Full Text Sources
Other Literature Sources
